Monitoring Through Firewalls
Firewall restrictions are the most common reason server monitoring doesn't "just work." The agent auto-detects on your local network and connects automatically in many cases. When it doesn't, you have two options:
- Open firewall ports to allow live connections
- Collect stats files manually and load them after the test (no firewall changes needed)
Most customers choose manual stats collection when firewall policies are restrictive. It's straightforward and doesn't require IT approval to open ports. This guide covers both approaches, starting with the one that doesn't require a ticket to your network team.
Option 1: Manual Stats Collection (No Firewall Changes)
This is the easiest approach when you can't or don't want to open firewall ports. The agent collects data locally on the server, you run your load test, then you import the stats file afterward.
How it works:
1. Start the agent on the server before the test
2. Tell the agent to log performance data locally
3. Run your load test (agent collects data, no connection to Load Tester needed)
4. Stop the agent after the test
5. Collect the .dat stats file and import it into Load Tester
This works without opening any firewall ports.
Step 1: Start the Agent
On your server, start the agent as usual:
Windows:
Linux:
The agent starts and waits for commands.
Step 2: Begin Manual Data Collection
On the agent console, type:
Use the same sample period as your load test (typically 10 seconds). You can optionally name the log file:
The agent will print the log file path:
ServerMonitorAgent: prepared for test 2026_02_10_143022_edt_production-test-500vu.
Results will be logged to ~/.webperformance/AgentLogs/2026_02_10_143022_edt_production-test-500vu.dat
Save that path. You'll need it after the test.
Step 3: Run Your Load Test
Run your load test in Load Tester as usual. The agent is collecting data locally on the server; no connection between Load Tester and the agent is needed.
Important timing tips: - Start the agent log before starting the load test - Keep the agent running until after the load test completes - Make sure the system clocks on both the server and Load Tester workstation are synchronized (same time zone, correct time/date)
Step 4: Stop Data Collection
After your load test finishes, go back to the agent console and type:
Critical: Always run stop-log before quit to ensure all data is written to disk.
The agent console will confirm the log file location. If you didn't note it earlier, find it here:
- Linux:
~/.webperformance/AgentLogs/ - Windows:
%USERPROFILE%\.webperformance\AgentLogs\
Copy the .dat file to your Load Tester workstation.
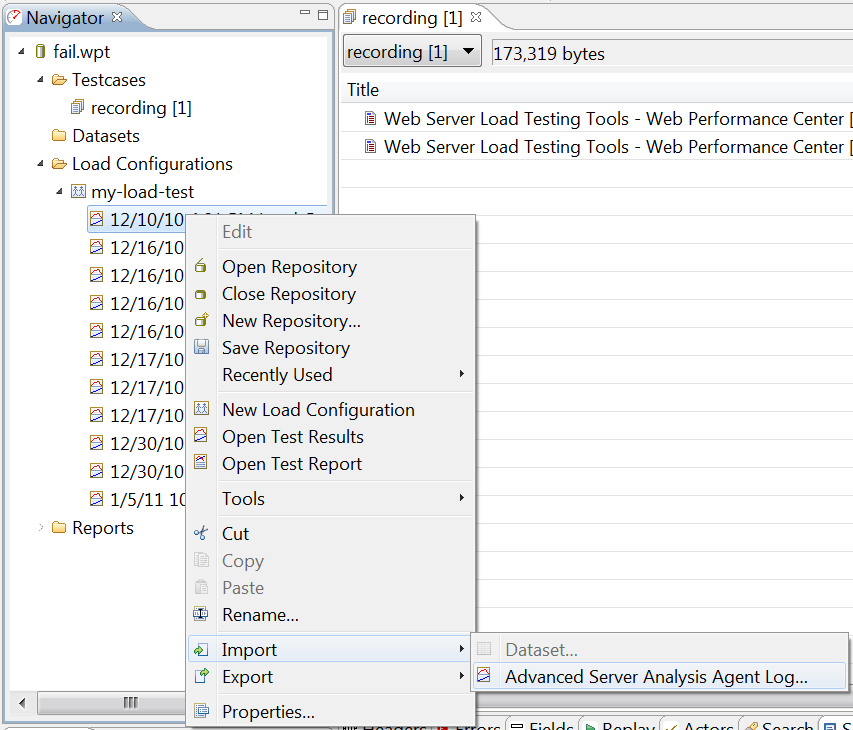
Step 5: Import the Stats File into Load Tester
- Open your completed load test result in Load Tester
- Right-click the test result → Import → Advanced Server Analysis Agent Log...
- Browse to the
.datfile you copied from the server - Click Add to select the file
You'll see:
Configure the import:
- Server name: Update to match your server (this is how it appears in reports)
- Mode: Choose Advanced (if you have a license) or Basic (CPU/memory only)
- Log file Lead Time: Leave at 0 unless you started logging early (adjusts time correlation)
Click OK to import.
The server metrics will integrate into your test results. Re-open the load test report to see:
- Server metrics in the Servers section
- Correlation between server CPU/memory and client response times
- Performance checklist highlighting bottlenecks
Troubleshooting Manual Collection
Agent log file is empty or too short:
- You ran quit before stop-log, so data wasn't flushed to disk
- Solution: Always run stop-log first, then quit
Time correlation is off (metrics don't line up with test): - System clocks on server and Load Tester workstation weren't synchronized - Solution: Check time zones and clock accuracy on both machines before the next test
Import fails with "incompatible format": - Agent version doesn't match Load Tester version - Solution: Upgrade the agent to match your Load Tester version
Option 2: Open Firewall Ports (Live Connection)
If you can open firewall ports, the agent can connect to Load Tester in real time. You'll see server metrics live during the test, with no manual file collection needed.
Ports required: - 1099: Main agent communication - 1100: Auto-detection (optional, but helpful)
Basic Firewall Configuration
Allow inbound connections to the server on ports 1099 and 1100 from the Load Tester workstation.
If you're monitoring multiple servers, each agent needs its own pair of ports (1099/1100 for server 1, 1101/1102 for server 2, etc.). This gets complex fast, which is why most customers prefer manual stats collection.
Advanced Configuration: Specifying Ports and IP Addresses
If the agent can't auto-detect or you need to specify which network interface to use, edit system.properties in the agent installation directory.
Create or edit system.properties:
What each setting does:
| Setting | Purpose |
|---|---|
RmiAgentAddress |
Which local IP address the agent listens on. Useful if the server has multiple NICs or IPv4/IPv6 conflicts. |
RmiRegistryPort |
Port for initial connection (default 1099). |
RmiAgentPort |
Port for ongoing communication (default: any available). Set this to the same as RmiRegistryPort to simplify firewall rules. |
After editing, restart the agent to apply changes.
NAT and Public IP Configuration
If the agent is behind a NAT or firewall with a different public IP, tell the agent its public hostname/IP.
Edit Server Monitor Agent.lax (in the agent installation directory) and add:
to the end of the lax.nl.java.option.additional line. For example:
lax.nl.java.option.additional=-Djava.library.path=lib32 -Djava.rmi.server.hostname=site.mycompany.com
If the line doesn't exist, add it at the end of the file (with a blank line after it).
Restart the agent.
Multiple Agents Behind a Single Public IP
If you have multiple agents behind one firewall IP, each agent MUST use different port numbers, and those port numbers MUST match on both the agent and the firewall.
Example:
| Server | RmiRegistryPort | Firewall Mapping |
|---|---|---|
| Server 1 | 1099 | Firewall IP:1099 → Server 1:1099 |
| Server 2 | 1101 | Firewall IP:1101 → Server 2:1101 |
| Server 3 | 1103 | Firewall IP:1103 → Server 3:1103 |
Critical: Port mapping on the firewall must use the SAME port numbers as the agent. Mapping firewall port 1099 to agent port 2000 will not work. The agent expects both sides to use 1099.
Which Approach Should You Use?
| Situation | Recommended Approach |
|---|---|
| Locked-down production environment | Manual stats collection (no firewall changes) |
| Security policies prevent opening ports | Manual stats collection |
| Testing a single server, can open ports | Live connection (easier, real-time visibility) |
| Monitoring multiple servers | Manual stats collection (avoid complex port mapping) |
| Want real-time metrics during test | Live connection (if firewall allows) |
Most customers choose manual stats collection because it works without IT approval and doesn't require firewall changes. The only trade-off is that you import the file after the test instead of seeing metrics live.
Next Steps
- Manual collection workflow: See Server Monitoring Agent for detailed agent commands
- Interpreting metrics: See Metrics & Counters for what each metric means
- Performance analysis: Use the Server Performance Checklist to identify bottlenecks after importing server data