Legacy Reports
v7.0 has better options for most uses
For interactive analysis: use the Embedded Analytics Dashboard (drill-down, AI insights, real-time metrics).
For sharing results with your team: give them access to the analytics portal, where shared test results are viewable live.
For executive summaries and archived reports: use the AI-generated DOCX reports. The AI Analyst produces a draft DOCX, the test engineer edits it, then shares.
Legacy reports (this page) are kept in the app for users transitioning from v6.0 who prefer the familiar report format, or for baseline capacity estimates before load testing. They are not the recommended sharing or archival path.
What Are Legacy Reports?
Legacy reports are static HTML documents generated from test data, designed for v6.0 compatibility and offline distribution. Unlike the interactive dashboard, they are read-only snapshots: frozen in time, portable, and complete.
The three legacy report types:
| Report Type | Purpose | When to Use |
|---|---|---|
| Test Case Report | Validate test case correctness | After recording, after ASM, for replay trend tracking |
| Baseline Performance Report | Estimate capacity BEFORE load testing | Planning phase, capacity estimation |
| Load Test Report | Post-test view of v6.0-style report content | Familiar reading for v6.0 users |
Legacy reports open embedded in Load Tester and are read-only views of the underlying test data. For sharing with your team, use the portal. For executive summaries or archived deliverables, use AI-generated DOCX reports.
When to Use Legacy Reports vs. Dashboard
Use the Embedded Analytics Dashboard When:
✅ Analyzing active or recent load tests - Real-time interactive exploration
✅ Investigating bottlenecks - Drill down into specific transactions, user levels, time ranges
✅ Getting AI insights - Ask questions like "What's causing slow response times at 300 VUs?"
✅ Comparing metrics across time - Interactive charts with zoom, filter, comparison views
✅ You're at your desk with Load Tester open - Dashboard is built-in, no export needed
See: Embedded Analytics Dashboard for interactive analysis workflow.
Use Legacy Reports When:
✅ Baseline capacity planning - Estimate performance BEFORE running load tests (Baseline Performance Report)
✅ v6.0 migration - Familiar format if transitioning from v6.0 workflows
Use Other Paths For:
For sharing, archival, and executive summaries, legacy reports are not the right tool. Instead:
- Sharing with the team → analytics portal (live shared access)
- Executive summaries and archived deliverables → AI-generated DOCX reports (the AI Analyst drafts the report, you edit, then share)
- Interactive analysis → Embedded Analytics Dashboard
Test Case Report (Legacy): Validate Test Case Correctness
Purpose: Verify your test case is configured correctly: all pages load, no errors, response times are reasonable.
When to use:
- ✅ After recording - Verify recording captured everything correctly
- ✅ After ASM configuration - Verify correlation worked (no 401/403 errors)
- ✅ After replay - Track performance trends across multiple replays
What the report shows:
- Summary: Total pages, transactions, errors, average response times
- Pages: Per-page response times and transaction counts
- URLs: Individual transaction details (response codes, sizes, durations)
- Trend (if replays exist): Performance trends over time
- Errors: All errors encountered during replay
How to Generate a Test Case Report (Legacy)
Method 1: From Navigator
- Expand your test case in Navigator view
- Right-click the test case name
- Select "Open Test Case Report (Legacy)"
Method 2: From Test Case Editor
- Open test case in Test Case Editor
- Click dropdown next to "Report" button in toolbar
- Select "Legacy Report"
Reading the Test Case Report (Legacy)
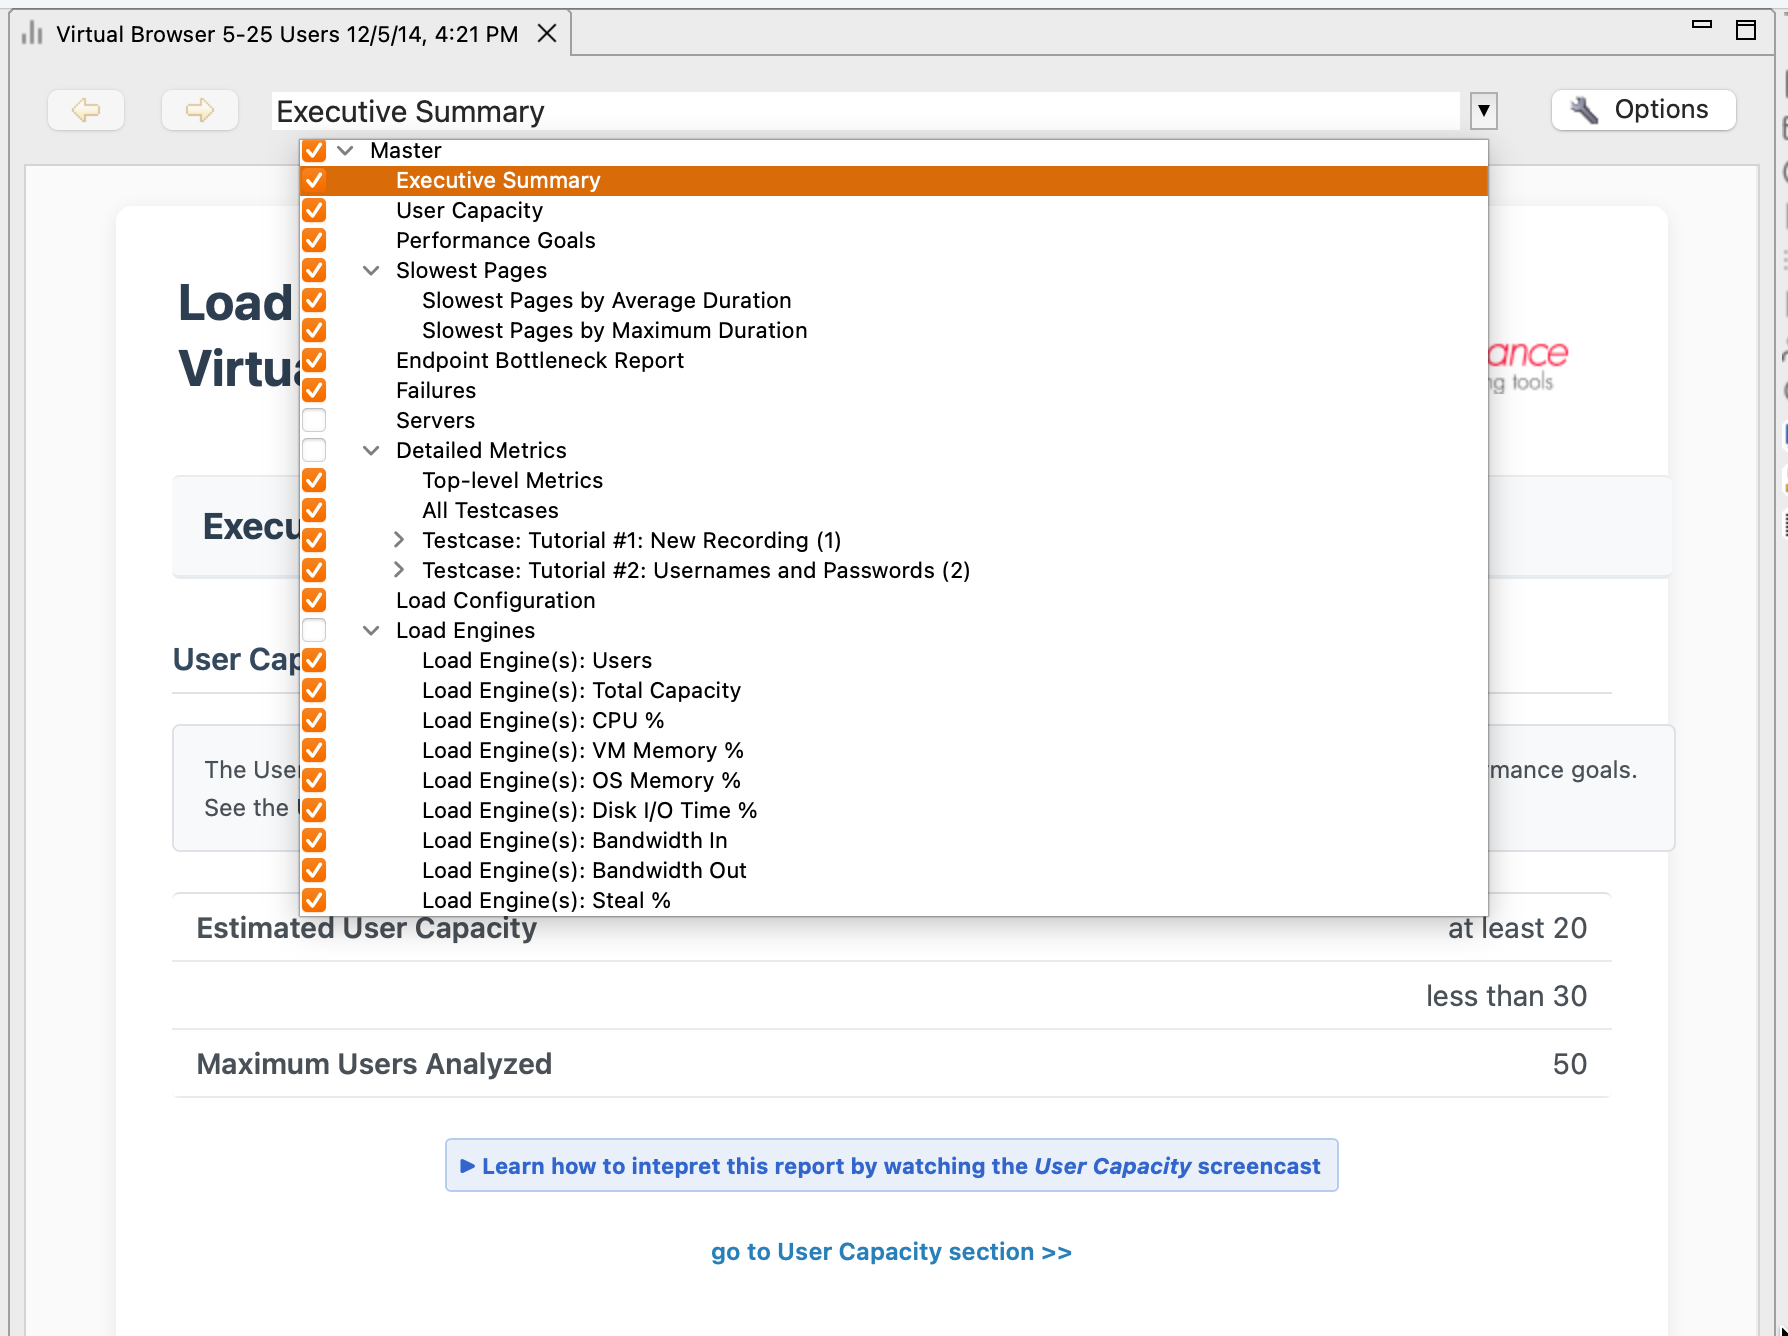
The report opens embedded in Load Tester with dropdown navigation at the top:

Navigate using the dropdown at the top of the report pane. The dropdown lists the report sections:
- Summary - High-level overview (total pages, errors, response times)
- Pages - Per-page breakdown (which pages are slow?)
- URLs - Transaction-level details (which specific requests failed?)
- Trend - Performance over time (if multiple replays exist)
- Errors - Error catalog (what went wrong?)
Summary Section: Quick Assessment
What you see:
| Metric | Example Value | What It Means |
|---|---|---|
| Total Pages | 5 | Test case has 5 pages |
| Total Transactions | 47 | 47 HTTP requests total |
| Errors | 0 | No errors (good!) |
| Average Response Time | 245ms | Typical response time |
| Total Data Transferred | 1.2 MB | Total download size |
What to look for:
- ✅ Errors = 0 → Test case works
- ⚠️ Errors > 0 → Check Errors section for details
Baseline Performance Report (Legacy): Estimate Capacity Before Load Testing
Purpose: Predict how your application will perform under load WITHOUT actually load testing it.
When to use:
- ✅ Before load testing - Estimate bandwidth and capacity requirements
- ✅ During planning - Set performance goals and identify potential issues early
- ✅ For capacity planning - Estimate infrastructure costs before provisioning
What the report shows:
- Analysis Summary: Overall verdict (will performance goals be met?)
- Bandwidth Estimates: Min/max bandwidth needed to support target user count
- Goals Section: Which pages will meet/fail performance goals under simulated bandwidth
How to Generate a Baseline Performance Report (Legacy)
Method 1: From Test Case
- Right-click test case in Navigator
- Select "Open Baseline Report"
- Configure load parameters:
- Target VU count (e.g., 500 concurrent users)
- Simulated bandwidth (e.g., 10 Mbps per user)
- Performance goals (e.g., pages should load < 2000ms)
- Click OK
Reading the Baseline Performance Report (Legacy)
The report predicts performance based on single-user response times and simulated constraints:
Key sections:
Analysis Summary
Based on single-user performance and simulated bandwidth of 10 Mbps:
- 4 of 5 pages will meet performance goals (< 2000ms)
- 1 page (Dashboard) will NOT meet goals (estimated 3500ms)

Bandwidth required: 45-90 Mbps to support 500 concurrent users
Bandwidth Estimates
| Metric | Value | What It Means |
|---|---|---|
| Minimum Bandwidth | 45 Mbps | All users viewing smallest pages |
| Maximum Bandwidth | 90 Mbps | All users downloading largest pages |
| Recommended NIC | 1 Gbps | Provision at least 1 Gbps network |
Goals Section
| Page | Estimated Load Time | Goal | Will Meet Goal? |
|---|---|---|---|
| Homepage | 600ms | < 2000ms | ✅ Yes |
| Dashboard | 3500ms | < 2000ms | ❌ NO |
Load Test Report (Legacy): Static Snapshot for Archival
Purpose: Comprehensive post-load-test analysis as a static HTML document for archival, offline sharing, or executive summaries.
When to use:
- ✅ Archiving test results - Long-term storage (dashboard only shows recent tests)
- ✅ Offline distribution - Email to stakeholders or save as PDF
- ✅ Executive summaries - Print-friendly format for management
- ✅ Compliance/audit - Static documentation of test results
What the report shows:
- Test Summary: High-level results (passed/failed, capacity limits, error rates)
- Response Time Charts: Performance trends across VU levels
- Throughput Analysis: Hits/sec, bandwidth, VU distribution
- Server Metrics: CPU, memory, disk, network by server
- Page Breakdown: Per-page response times, errors, degradation patterns
- Error Catalog: All unique errors with counts and examples
How to Generate a Load Test Report (Legacy)
Method 1: From Load Test Results View
- Wait for test to complete
- Click dropdown next to "Report" button
- Select "Legacy Report"
Method 2: From Navigator
- Expand test case → Load Test Results
- Right-click a load test result
- Select "Open Legacy Report"
Reading the Load Test Report (Legacy)
The report is comprehensive (20-50 sections, depending on test complexity). It opens embedded in Load Tester; use the dropdown at the top to jump between sections:
Key sections:
Test Summary
Load Test Summary

Test: 500 VUs ramped over 60 minutes
Duration: 60:15
Total Hits: 1,247,583
Error Rate: 2.3% (28,754 errors)

VERDICT: ❌ FAILED
- Response times exceeded 2000ms at 350 VUs
- Server CPU maxed out at 95%

Capacity Limit: ~300 concurrent users
Server Metrics
| Server | CPU % | Memory % | Diagnosis |
|---|---|---|---|
| Web Server | 45% | 50% | Plenty of capacity |
| Database | 95% | 60% | CPU bottleneck |
Report Actions: Save, Export, Print
All legacy reports support:
| Action | What It Does | When to Use |
|---|---|---|
| Print current section | Physical handouts | |
| Save as Web Archive (.mht) | Single-file bundle (HTML + images) | Email distribution |
| Save as HTML | Separate HTML file + image folder | Web hosting |
| Print to PDF | Static PDF document | Executive summaries |
Saving Legacy Reports for Distribution
Option 1: Save as Web Archive (.mht)
- File → Save As
- Select "Web Archive (.mht)" format
- Save to file
Benefit: Single file, easy to email.
Drawback: Some browsers don't support .mht (deprecated in Chrome).
Option 2: Save as HTML
- File → Save As
- Select "Web Page, complete"
- Saves HTML + images folder
Benefit: Works in all browsers.
Drawback: Must distribute entire folder (HTML + images).
Option 3: Print to PDF
- File → Print
- Select printer → "Save as PDF"
- Save PDF
Benefit: Universal format, works everywhere.
Drawback: Loses interactivity (can't expand/collapse sections).
Legacy Reports vs. v7.0 Dashboard: Feature Comparison
| Feature | Legacy Reports | Embedded Analytics Dashboard |
|---|---|---|
| Format | Static HTML | Interactive React app |
| Real-time updates | ❌ No (snapshot) | ✅ Yes (live during test) |
| Drill-down | ❌ No | ✅ Yes (click to zoom, filter) |
| AI insights | ❌ No | ✅ Yes ("What's causing slow responses?") |
| Offline sharing | ✅ Yes (save HTML/PDF) | ⚠️ Limited (screenshot only) |
| Archival | ✅ Yes (permanent HTML) | ⚠️ Dashboard shows recent tests only |
| Comparison | ❌ Manual (open multiple reports) | ✅ Built-in (compare across tests) |
| Customization | ❌ Fixed layout | ✅ Configurable charts, filters |
| Performance | ⚠️ Slow to generate (large tests) | ✅ Fast (data already in memory) |
Use the dashboard for analysis. Use legacy reports for archival and sharing.
Migration Guide: v6.0 Reports → v7.0 Dashboard
If you're transitioning from v6.0:
What Stayed the Same
✅ Test data format (results still stored in .wpt files)
✅ Legacy reports still available (same generation workflow)
✅ All metrics captured (response times, throughput, errors, server metrics)
What Changed
🆕 Primary interface is now the Dashboard (not reports)
🆕 Interactive exploration replaces static report navigation
🆕 AI-powered insights available in dashboard (not in reports)
🆕 Real-time monitoring during active tests (dashboard updates live)
Recommended Workflow Change
v6.0 workflow:
v7.0 workflow:
Legacy reports still useful for: - Archiving results for compliance/audit - Sharing with stakeholders without Load Tester access - Baseline capacity planning before load testing
Next Steps
For interactive analysis (recommended):
- Embedded Analytics Dashboard - Real-time interactive metrics (v7.0)
- AI for Performance Analysis - AI-powered bottleneck identification
For understanding results:
- Load Test Results Overview - Navigate the results interface
- Understanding Metrics - Interpret performance metrics
- Identifying Bottlenecks - Correlation techniques
Related Topics: