Quick Start Tutorial
This tutorial walks through the complete load testing workflow from start to finish. In under 30 minutes, you'll record a test case, validate it replays correctly, and run your first load test.
This is the same workflow you'll use for every load testing project. The steps don't change; only the complexity does.
Prerequisites
Before starting, make sure you've installed Load Tester and have Google Chrome 90+ installed (recording in v7.0 uses a Chrome extension). The first time you click Record, Load Tester walks you through installing the extension via the Extension Setup Wizard, a one-time in-app step. See Browser Configuration for the full setup walkthrough if you'd like to do it ahead of time.
No license is required. You can complete this entire tutorial on the Free tier. If you have a Pro license, see License Activation to activate it.
Step 1: Record a Test Case
A test case is a recorded sequence of HTTP requests representing a user's workflow through your application.
Choose a Target
For this tutorial, pick something simple: your own application, a public demo site, or any website where you can browse a few pages. Visit a homepage, click through to a product or detail page, maybe submit a form. Three to five page views is plenty for a first recording.
Record
- Click Record in the toolbar. First time only: the Extension Setup Wizard appears. Follow the three steps to install the Chrome extension (covered in detail in Browser Configuration). You'll only see this once
- The Recording Wizard opens. Select Chrome as your browser, give the test case a name (e.g., "My First Test"), and click Finish
- Chrome launches. Browse your target site normally for 3-5 pages
- When you're done browsing, click Stop in the toolbar
Your test case appears in the Navigator and opens in the Test Case Editor.
What Gets Recorded
Load Tester captures every HTTP/HTTPS request: HTML pages, images, CSS, JavaScript, AJAX calls, API requests. Everything your browser sends over the network gets recorded.
Inspect the Recording
Review what was captured in the Test Case Editor. Each row represents one HTTP request. You'll see page names, response codes (200 = success), response sizes, and response times.
If the pages you visited appear in the list with 200 response codes, your recording worked.
Step 2: Configure with ASM
Before you can replay the test case with virtual users, you need to handle dynamic values that change between sessions (session IDs, CSRF tokens, etc.). Replaying stale recorded values will fail because the server expects fresh ones.
Load Tester includes Application State Management (ASM), a rules-based expert system that identifies and configures dynamic values automatically.
- With your test case selected, choose Tools → Application State Management
- Click Finish to run automatic detection
ASM analyzes your test case and configures session cookies, CSRF tokens, dynamic URL segments, bearer tokens, and platform-specific state (.NET ViewState, Salesforce tokens, etc.).
- Check the Fields View to see what ASM found
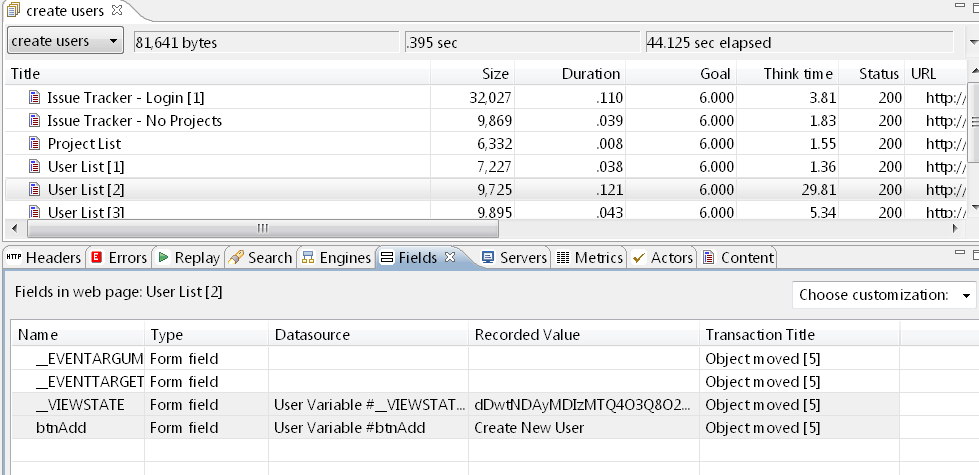
Fields with a gray background were automatically configured. For most applications, ASM handles everything. You don't need to create extractors or field assignments by hand unless ASM missed something.
New in v7.0: AI-Powered Dynamic Detection
If ASM misses a field, the AI assistant can analyze replay failures and generate custom detection rules automatically. See AI for Configuration.
Step 3: Replay
Now validate that your configured test case actually works by replaying it with a single virtual user.
- Click Play in the toolbar
- Accept the defaults in the Replay Wizard and click Finish
- Watch the Replay View as pages are replayed one by one
The status shows green checkmarks for successful requests and red for errors. A successful replay typically takes 30-60 seconds.
If replay succeeds: you're ready for load testing.
If replay fails: the most common causes are missing session correlation, CSRF tokens ASM didn't detect, or dynamic URL parameters. See Debugging Failed Replays. If one virtual user can't complete the workflow, a thousand certainly can't.
Step 4: Configure a Load Test
A load test runs your validated test case with multiple virtual users simultaneously, measuring how the application performs under real traffic.
- Right-click your test case in the Navigator and select New → Load Configuration
- Set the basic parameters:
| Setting | Value | Why |
|---|---|---|
| Virtual Users | 10 | Start small for your first test |
| Ramp-Up Time | 2 minutes | Gradually increase from 0 to 10 users |
| Hold Time | 5 minutes | Maintain 10 users for steady-state measurement |
| Think Time | 10 seconds | Realistic pause between pages (real users read, type, think) |
- Save the load configuration (File → Save or Ctrl/Cmd+S)
Start Small
Ten virtual users for five minutes is enough to verify the test works without overwhelming your application. Scale up after you've confirmed the basics.
Step 5: Run the Load Test
- Click Start Load Test in the toolbar
The Load Test Status View opens showing real-time metrics: current virtual user count (ramping from 0 to 10), throughput (requests per second), response times, and error count.
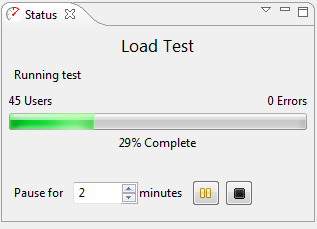
Watch the metrics update every few seconds as virtual users ramp up. The test runs for about 7 minutes total (2 min ramp + 5 min hold).
Step 6: Analyze Results
After the test completes, the results tell you how your application performed under load.
What to Look For
Good signs:
- Error rate at zero (no failed requests)
- Response times stable throughout the test (no degradation as users ramp)
- Throughput scales proportionally with virtual user count
Warning signs:
- Response times climbing as users increase (performance degradation)
- Error rate above zero (application returning errors under load)
- Throughput plateaus before reaching target users (bottleneck)
Establish Your Baseline
Note your metrics at 10 users: average response time, maximum throughput, slowest pages. This is your performance baseline, the starting point for optimization and capacity planning.
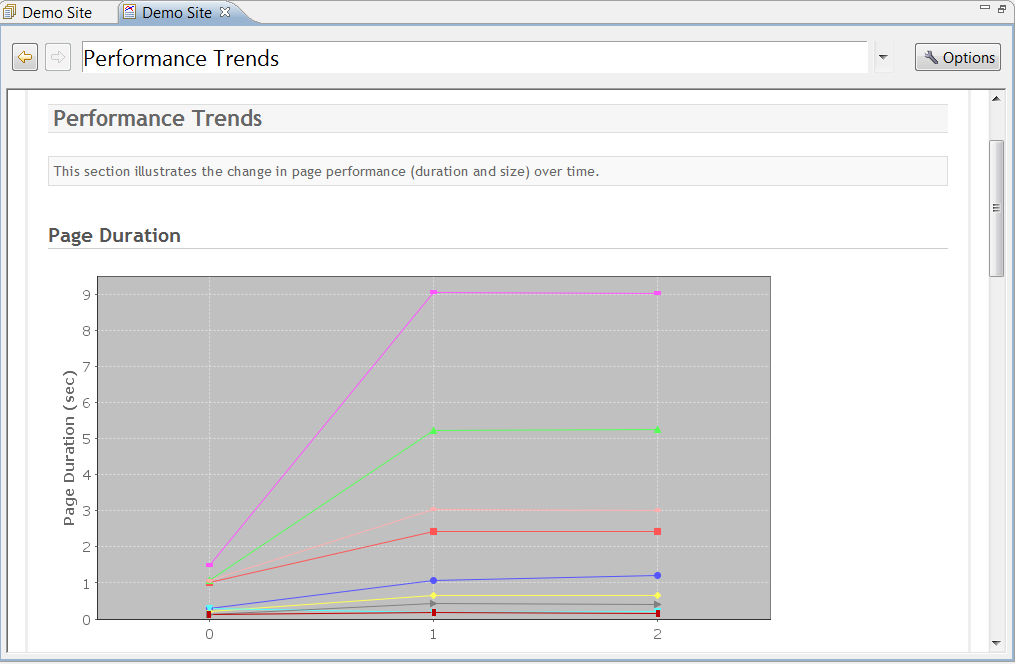
Use the Analytics Dashboard
For deeper investigation, open the Embedded Analytics Dashboard (new in v7.0). It provides interactive charts, drill-down by page and user level, server metric correlation, and AI-powered analysis. See Analytics Dashboard.
What You've Accomplished
You've completed the entire load testing workflow:
- Recorded a test case capturing a user workflow
- Configured dynamic values with ASM
- Validated the test case replays successfully
- Created a load configuration with 10 virtual users
- Executed a load test with real-time monitoring
- Analyzed results to establish a performance baseline
From here, everything is about doing more of the same with more complexity: testing login workflows with Authentication, scaling to thousands of users with Cloud Load Testing, analyzing bottlenecks with the Analytics Dashboard, and getting AI help when things go wrong.
Next Steps
Go Deeper on Each Phase
Recording: Browser Configuration, Recording Settings, Recording Troubleshooting
Configuration: Web Pages & Application State, ASM Overview, Authentication, Datasets
Replay: Understanding Results, Debugging Failed Replays
Load Testing: Concepts, Configuring, Cloud Engines
Monitoring: Server Monitoring, Monitoring During Tests
Analysis: Understanding Metrics, Performance Workflow, Bottlenecks, Analytics Dashboard
Common Questions
How many virtual users should I use? Start small (10-25) to validate, then increase. Development testing: 10-50 users. Capacity planning: ramp to your target production traffic. Stress testing: push beyond expected capacity to find breaking points.
How long should the test run? Quick validation: 5-10 minutes at steady state. Capacity test: 30-60 minutes at target load. Soak test: 4-8 hours to find memory leaks and gradual degradation. Longer tests reveal problems that hide in short runs.
What if replay fails? Missing session correlation, undetected CSRF tokens, or dynamic URL parameters. See Debugging Failed Replays.
Can I test localhost?
Yes. Load Tester works with localhost, 127.0.0.1, and local network addresses. Just make sure your development server can handle multiple concurrent connections.
How do I test login workflows? Record the login (navigate to login page, enter credentials, submit), run the Configure for Replay wizard, and use a dataset with multiple username/password combinations for realistic multi-user testing.
Related Topics: - Navigating the UI - Load Test Concepts - Web Pages & Application State - AI Assistant Overview