Basic Server Monitoring
Before you read this: If you already have an enterprise monitoring tool (Datadog, New Relic, DynaTrace, etc.), use that instead. Enterprise APM tools provide far more metrics, better root cause analysis, and performance profiling that WP Load Tester's basic monitoring can't match. Run your load test and monitor your backend in your APM dashboard. No integration needed.
CloudWatch users: Native CloudWatch integration is coming in v7.0, letting you view CloudWatch metrics directly alongside load test results.
When to Use WP Load Tester's Server Monitoring
Use the methods below if you don't have an enterprise APM tool and need to monitor CPU and memory during load tests. Basic monitoring is included in Load Tester at all tiers; no license required. It's straightforward to set up and works without firewall changes if you collect stats files manually.
This guide covers the four ways to configure basic monitoring. Choose the method that matches your environment, follow the steps, and you'll have server metrics correlated with your response times.
Adding a Server to Monitor
To start monitoring a server, open the Servers View and click the Add... button. You'll see this dialog:
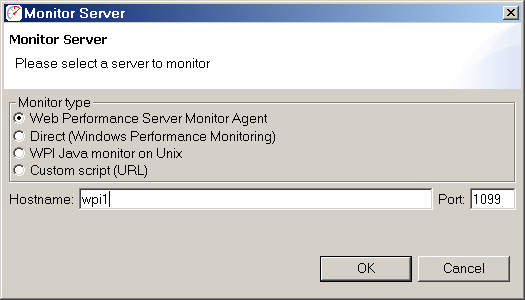
Every monitor type is added the same way: open the Servers View, click Add…, pick the monitor type, configure the type-specific fields, and click OK. Here are the options:
| Method | When to Use It |
|---|---|
| Web Performance Server Monitor Agent | Best option for non-AWS hosts. Works on Windows and Linux, provides both basic and advanced metrics, auto-detects on local network. |
| Windows to Windows | Local networks only. No installation required, but requires Windows authentication on both machines. NOT suitable for production (see warning below). |
| Java-based Server on Unix | Deploy a WAR file to your Java application server (Tomcat, JBoss, WebSphere, etc.) for monitoring on Solaris/Linux. |
| Custom Script | Write a simple HTTP script that returns CPU and memory in plain text format. Works on any platform not covered above. |
| AWS CloudWatch (EC2 instance metrics) | EC2 instances only. No agent installation. Uses your AWS credentials to read CloudWatch metrics. Supports cross-account access. See Amazon CloudWatch Monitoring. |
Let's walk through each method.
Method 1: Web Performance Server Monitor Agent (Recommended)
This is the most flexible option. The agent runs on Windows or Linux, works in both basic and advanced mode, and auto-detects on your local network so you don't have to configure IP addresses manually.
Step 1: Download and Install the Agent
- Go to www.webperformance.com/download/
- Click the green Server Monitor button for Windows 64-bit, or click Other platforms to see Linux/32-bit options
- Run the installer (Windows) or untar the archive (Linux)
The agent installs in its own directory and doesn't modify the registry or install services. Safe to run on production systems.
Step 2: Start the Agent
Windows: Run the agent from the installation directory. See Server Monitoring Agent for command-line options.
Linux:
Important: If you SSH into the server, run the monitor in screen or a similar utility. It isn't a daemon. It will die the moment your SSH session times out.
After starting, you'll see:
Web Performance Server Monitoring Agent version 7.0.xxx now monitoring.
Agent listening on port 1099.
Step 3: Configure in Load Tester
In most cases, the agent will auto-detect and appear in the Servers View automatically. If it doesn't (multicast blocked on your network), manually add it:
- Click Add... in the Servers View
- Select Web Performance Server Monitor Agent
- Enter the IP address or hostname of the server running the agent
- Use port 1099 (default) unless you configured a different port
- Click OK
The Load Tester will verify the connection. If it succeeds, you're done. Server monitoring is configured.
Step 4: Choose Basic or Advanced Mode
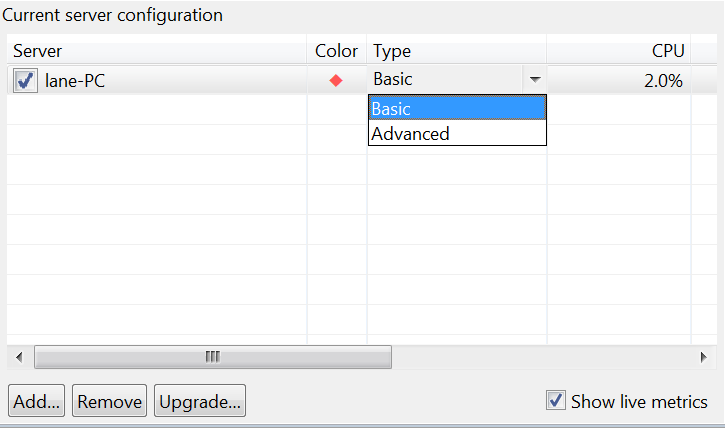
Server monitor agents default to advanced mode (detailed metrics). Advanced mode is available in the Pro tier. If you're on the Free tier, or if you simply want fewer metrics, switch the agent to basic mode in the Servers View to monitor CPU and memory only. Basic mode is available at every license tier.
Method 2: Direct Windows Monitoring (Local Networks Only)
If both your Load Tester controller and target server are Windows, you can use built-in Windows performance APIs. No agent installation needed.
⚠️ Important: This method is only practical on local networks where you have Windows authentication privileges on the target server. It requires establishing Windows authentication (browsing to \\servername\C$ and entering credentials) before the test, so it's not suitable for production environments. Most production environments don't allow that kind of direct access.
Use this for: Development/test environments on your local network where you have admin access.
Prerequisites
- Both machines must be Windows (controller and server)
- Local network access (not across VPN or complex firewalls)
- Windows authentication privileges to monitor the remote server
- You must establish authentication before starting the test
Step 1: Establish Authentication
Before configuring monitoring, log into the Windows server from your client machine. This establishes the Windows authentication that direct monitoring depends on.
Easiest way: Browse to a network share on the server that requires authentication (e.g., \\servername\C$). Enter your credentials when prompted. This establishes the necessary permissions.
Step 2: Add the Server
- Click Add... in the Servers View
- Select Windows to Windows
- Enter the server's IP address or hostname
- Click OK
The Load Tester will attempt to connect using the Windows Performance Monitor (perfmon.exe) APIs. If authentication is set up correctly, the connection will succeed.
What it monitors: Direct Windows monitoring is equivalent to using perfmon.exe to monitor the % Committed Bytes In Use counter of the Memory performance object on the remote server.
Method 3: Java-Based Server on Unix
If you're running a Java application server (Tomcat, JBoss, WebSphere, etc.) on Solaris or Linux, deploy the WPIMonitor.war file.
Step 1: Deploy the WAR File
- Find
WPIMonitor.warin your Load Tester installation folder - Copy it to your application server's deployment directory (e.g.,
/opt/tomcat/webapps/) - Restart the application server (or hot-deploy if supported)
The WAR file installs a servlet named Monitor at the path /WPIMonitor/monitor.
Step 2: Configure in Load Tester
- Click Add... in the Servers View
- Select Java-based server on Unix
- Enter the base URL of your application server (e.g.,
http://yourserver:8080) - The Load Tester will append
/WPIMonitor/monitorto access the servlet - Click OK
The Load Tester will verify that the servlet is responding correctly.
Note: If you modify the deployment descriptor and change the servlet path, you'll need to use Custom monitoring (Method 4) and provide the full URL to your servlet.
Method 4: Custom Monitoring (Server Script)
For platforms not covered by the other three methods, write a simple HTTP script that returns CPU and memory percentages in plain text.
Script Requirements
Your script must return plain text (MIME type text/plain) in this format:
- CPU%: Current CPU utilization (0-100)
- memory%: Current memory utilization (0-100)
Example Script (Python)
#!/usr/bin/env python3
import psutil

print("Content-Type: text/plain\n")
print("version=1")
print(f"CPU%={int(psutil.cpu_percent())}")
print(f"memory%={int(psutil.virtual_memory().percent)}")
Make this script accessible via HTTP (e.g., through CGI, a simple web server, or a serverless function).
Configure in Load Tester
- Click Add... in the Servers View
- Select Custom monitoring (server script)
- Enter the full URL to your script (e.g.,
http://yourserver/cgi-bin/monitor.py) - Click OK
The Load Tester will fetch the URL and verify it returns data in the correct format.
Verification and Testing
After adding a server, the Load Tester immediately tests the connection when you click OK. If the test succeeds, you'll see the server listed in the Servers View.
If the connection fails:
- Agent: Check that the agent is running and port 1099 is accessible
- Windows Direct: Verify authentication is established (browse a network share first)
- Java WAR: Confirm the servlet is deployed and the application server is running
- Custom Script: Test the URL in a browser; it should return plain text in the required format
Running a Load Test with Server Monitoring
Once your server is configured:
- Start your load test as usual
- The Load Tester automatically connects to the server when the test starts
- CPU and memory metrics are sampled every 5-10 seconds
- Metrics appear in the Status View alongside response times, VU count, and hits/sec
- After the test, metrics are recorded in the results for post-test analysis
You don't need to do anything special. Just start the test, and server metrics are collected automatically.
Collecting Stats Files Manually (No Firewall Changes)
If you can't open firewall ports or prefer to collect stats files after the test:
- Start the agent on the server before the load test
- Run your load test (the agent collects data locally even without a connection)
- Stop the agent after the test (type
quiton the agent's command line) - Collect the stats file from
~/.webperformance/AgentLogs/(Linux) or%USERPROFILE%\.webperformance\AgentLogs\(Windows) - Load the stats file into Load Tester after the test for analysis
This approach works without opening ports 1099/1100, making it perfect for locked-down production environments.
See: Monitoring Through Firewalls for detailed firewall configuration.
What You'll See
During a load test with basic monitoring, the Status View shows:
- Response Time (client-side metric)
- CPU % (server-side metric)
- Memory % (server-side metric)
- VU Count (load level)
- Hits/sec (throughput)
The correlation is immediate: "Response times spiked at 500 VUs. CPU hit 95% at the same time. That's a CPU bottleneck."
If CPU and memory are low (under 80%) but response times are still slow, that's a signal to investigate other resources: database connections, thread pools, network latency. Finding those requires Advanced Server Monitoring.
Next Steps
- Start simple: Use the agent in basic mode or direct Windows monitoring for your first load test
- Correlate metrics: When response times degrade, check if CPU or memory spiked at the same time
- Upgrade if needed: If basic monitoring shows low utilization but response times are still slow, consider Advanced Server Monitoring for deeper visibility
Basic monitoring answers one question: "Is my server out of CPU or memory?" Yes means you know where to optimize. No means the bottleneck is hiding somewhere else.