Amazon CloudWatch Monitoring
New in v7.0. Native CloudWatch integration lets you monitor EC2 server metrics (CPU, memory, disk, network) directly from AWS CloudWatch. No agent installation needed. The same integration also monitors Amazon RDS databases, so a load test can watch the database tier alongside the application tier in one result.
The metrics flow directly into the load-test result alongside response times, errors, and throughput, which is what enables the AI assistant to do deep root-cause analysis: correlating a response-time spike against a CPU or memory pressure event on a specific instance, naming the cause, and explaining the chain. Without server data in the same dataset, the AI's analysis is limited to client-side symptoms and you do the cross-system correlation by hand. See Why This Matters for AI Analysis for the longer version.
CloudWatch monitoring is the right choice when:
- Your infrastructure runs on AWS EC2
- Your application uses an Amazon RDS database you want to watch under load
- You want server metrics without installing monitoring agents
- You need cross-account access (a consultant monitoring a client's servers, or an internal team monitoring across AWS accounts)
- You want AI-powered analysis of server metrics integrated with load-test results
How CloudWatch Monitoring Works
Load Tester connects to AWS CloudWatch APIs using your AWS credentials to collect EC2 metrics during load tests. Metrics flow directly into your load test results, where the AI assistant can analyze them for bottleneck identification and root cause analysis.
What gets collected for EC2 instances: - CPU utilization: Instance CPU percentage - Memory utilization: RAM usage (requires CloudWatch agent on EC2 instances) - Disk I/O: Read/write operations and throughput - Network: Data in/out, packets sent/received - Custom metrics: Any CloudWatch metrics your instances publish
What gets collected for RDS databases (from the AWS/RDS namespace, no agent required):
- CPU utilization: Database instance CPU percentage
- Freeable memory: Available RAM on the database instance
- Free storage space: Remaining allocated storage (also shown as a Disk % derived from allocated-vs-free storage)
- Database connections: Number of open connections
- Replica lag: Replication delay on a read replica
- Network: Throughput in and out of the database instance
Benefits over agent-based monitoring: - No software installation on servers - Works with any EC2 instance (Windows or Linux) - Uses CloudWatch data you're already collecting - Supports cross-account access (consultant/client scenarios) - Integrated with WPI AI assistant for automated analysis
Metric Resolution: Turn On Detailed Monitoring
By default, EC2 publishes CloudWatch metrics once every five minutes. That is fine for watching a slow daily trend, but it is close to useless for a load test that runs ten or fifteen minutes: five-minute data gives you two or three points, and a CPU spike that starts and ends between samples never shows up at all.
Load Tester reads each instance at whatever resolution AWS is publishing for it:
- Basic monitoring (the default): one data point every 5 minutes
- Detailed monitoring: one data point every minute
There is nothing to set for this in Load Tester. It checks each instance's monitoring state when it queries CloudWatch and automatically pulls 1-minute data for any instance that has detailed monitoring turned on, and 5-minute data for the rest. So the way to get 1-minute server metrics is to enable detailed monitoring on the EC2 instances themselves, before the test runs.
Load Tester polls CloudWatch every few seconds to keep the Servers tab live, but it can only show you the newest point CloudWatch actually has. With basic monitoring that point changes once every five minutes no matter how often you look, which is exactly why the finer resolution matters once a server is under load and the AI assistant is trying to line up a response-time spike against the CPU behind it.
Enable Detailed Monitoring on an Instance
In the EC2 Console: select the instance, then Actions → Monitor and troubleshoot → Manage detailed monitoring, check Enable, and save. Repeat for each instance you want at 1-minute resolution.
From the AWS CLI:
You can also turn it on when you first launch an instance: the launch wizard has a Detailed CloudWatch monitoring checkbox, and CloudFormation and Terraform both expose it as a Monitoring property. After you enable it, give CloudWatch a few minutes to start emitting 1-minute points, then run your test. The finer data shows up on its own, with no change on the Load Tester side.
In a cross-account (consultant/client) setup this is the client's job. Detailed monitoring is a property of the instance, so the account that owns the EC2 instances is the one that turns it on. A consultant with read-only access cannot, and should not be able to.
Detailed monitoring costs extra
AWS bills detailed monitoring per instance per month, on top of the per-request CloudWatch charges you already pay to read metrics. The amount is small, but it is not zero, so turn it on for the instances you care about during a test rather than across the whole fleet forever. Current rates are on the CloudWatch pricing page. Detailed monitoring only raises the frequency of the standard EC2 metrics. It does not add memory, which still needs the CloudWatch agent.
Setup with Access Keys (Simplest)
This is the fastest way to get CloudWatch metrics, and it splits cleanly into two roles. The server owner creates a read-only access key in the AWS account that owns the EC2 instances. The Load Tester operator enters that key into the app and picks which instances to watch. If you own the servers yourself, you play both roles. If you are a consultant monitoring a client's servers, the client does the owner part and hands you a key, and you do the rest. There is no IAM role, no trust policy, and no account IDs to exchange. If a security policy forbids sharing access keys at all, use Cross-Account Monitoring instead.
Grant read-only access (server owner)
Everything in this step happens in the AWS account that owns the EC2 instances, and it takes about five minutes. No AWS Console or dashboard access is handed out. Load Tester reads metrics through the AWS API, so all it needs is an access key for a user that carries the read-only policy below. Every action in that policy is read-only: the key cannot start, stop, change, or terminate anything, and cannot see billing.
The rds:DescribeDBInstances action is what lets Load Tester discover and monitor Amazon RDS databases. If you only monitor EC2 instances, you can leave it out; if you want the database tier in your results, keep it.
{
  "Version": "2012-10-17",
  "Statement": [
    {
      "Effect": "Allow",
      "Action": [
        "cloudwatch:GetMetricData",
        "cloudwatch:GetMetricStatistics",
        "cloudwatch:ListMetrics",
        "ec2:DescribeInstances",
        "ec2:DescribeVolumes",
        "ec2:DescribeRegions",
        "ec2:DescribeTags",
        "rds:DescribeDBInstances"
      ],
      "Resource": "*"
    }
  ]
}
- Create the read-only policy. In IAM → Policies → Create policy, switch to the JSON tab, paste the policy above, click Next, and name it
WPI-CloudWatch-ReadOnly. - Create a dedicated IAM user. In IAM → Users → Create user, name it something like
webperformance-monitoring, and leave console access turned off. On the permissions step, choose Attach policies directly and attachWPI-CloudWatch-ReadOnly. - Create an access key. Open the new user, go to Security credentials → Create access key, and choose Application running outside AWS (or Third-party service). AWS shows the Access Key ID and Secret access key once, so copy them now.
- Hand off three things to whoever runs Load Tester, sending the secret over a private channel rather than plain email:
- Access Key ID (it looks like
AKIA...) - Secret access key
- The AWS region(s) the servers run in, for example
us-east-1
- Access Key ID (it looks like
To revoke access at any time, delete the IAM user. The key dies with it.
Add the account in Load Tester (operator)
These steps happen in Load Tester, using the access key from the owner (or your own, if you own the servers).
- Open Preferences:
- Windows/Linux: Window → Preferences → Web Performance → Accounts → Amazon CloudWatch
-
macOS: Load Tester → Preferences → Web Performance → Accounts → Amazon CloudWatch
-
Click Add to create a new monitoring account.
-
Fill in account details:
- Name: a descriptive label, for example "Acme Production Servers"
- Access Key ID: the Access Key ID from the owner
- Secret Access Key: the secret access key from the owner
-
Regions: the region(s) the owner gave you
-
Click Verify Credentials to confirm access works.
-
Click OK to save.
The monitoring account is now available when configuring server monitoring for load tests.
Add servers to monitor (operator)
Servers are added the same way regardless of monitor type. CloudWatch is one of the monitor types available in the Add Server dialog.
- Open the Servers View (Window → Show View → Servers, if not already visible)
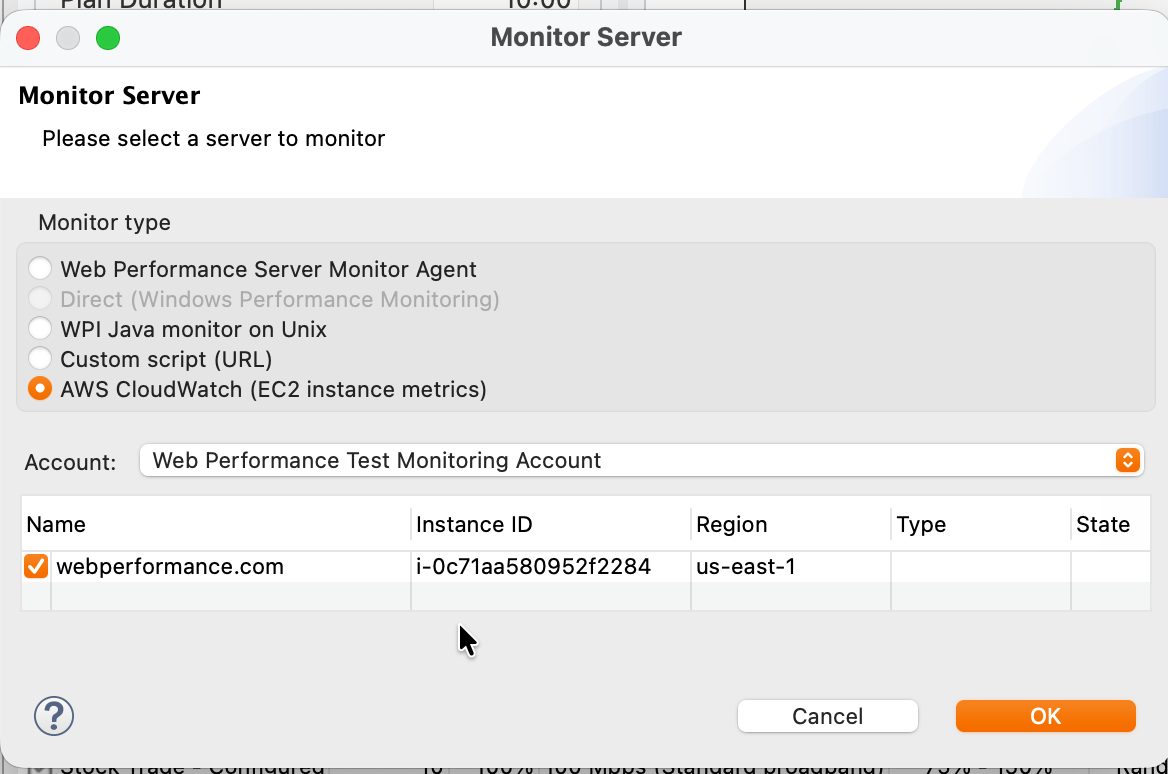
- Click Add…
- In the Monitor Server dialog, select AWS CloudWatch (EC2 instance metrics)
- Account: pick the CloudWatch monitoring account you configured above
- Check the EC2 instances to monitor. The dialog lists running instances discovered in the regions configured on the account.
- Click OK
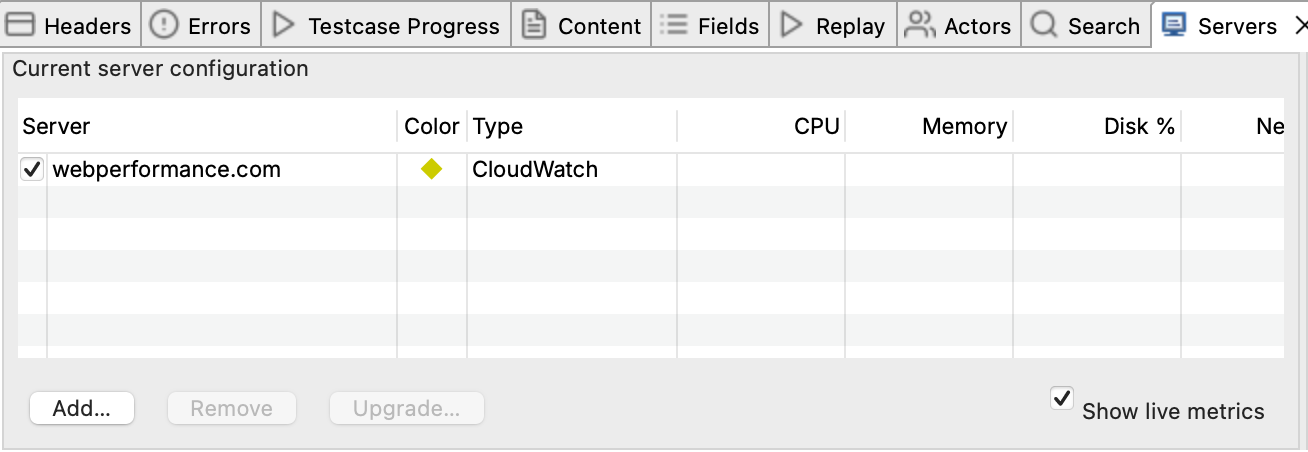
The selected instances now appear in the Servers View. When you start a load test, CloudWatch metrics flow into the test result alongside response times, and live values appear in the Servers tab, updated every sample period (typically 5 to 10 seconds).
Monitor an Amazon RDS Database
Amazon RDS databases are added through the same Monitor Server dialog as EC2 instances, using the same monitoring account. The account's rds:DescribeDBInstances permission is what lets Load Tester discover the databases running in the account's regions. If that permission is missing, EC2 monitoring still works and only the databases are left out.
Add a database individually (operator)
- Open the Servers View (Window → Show View → Servers, if not already visible)
- Click Add…
- In the Monitor Server dialog, select AWS CloudWatch (EC2 instance metrics). The same picker that lists EC2 instances also lists every RDS database discovered in the account's regions.
- Account: pick the CloudWatch monitoring account you configured earlier
- Check the database(s) to monitor. Database rows are marked in the Type column as
RDS: <engine>(for exampleRDS: postgresorRDS: aurora-mysql), so they are easy to tell apart from EC2 instances. - Click OK
When you start a load test, the database's AWS/RDS metrics flow into the result alongside response times, and live values appear in the Servers tab. The shared columns (CPU, Disk %, Network) populate for databases the same way they do for EC2 instances, and the full database metric set (connections, freeable memory, free storage, replica lag) lands in the report.
Follow a tag rule for databases
The standing CloudWatch tag rule matches RDS databases the same way it matches EC2 instances. Type a tag value into the tag filter at the top of the Monitor Server dialog and click Add to save it as a rule. A rule such as "follow tag sales" registers every database whose tag values contain that text, and it keeps watching: a database that comes up partway through the test (for example a new Aurora read replica) is discovered on the next rediscovery cycle, roughly every 60 seconds, and monitored automatically. The match count shown in the dialog counts EC2 instances and RDS databases together.
If no databases appear
If the picker lists no databases, or shows a status-line warning like "Databases (RDS) not listed in us-east-1: this monitoring account is not authorized for rds:DescribeDBInstances", the monitoring account's IAM user or role is missing the rds:DescribeDBInstances permission. Add it to the policy (see the access-key or cross-account role policy above) and reopen the dialog.
Cross-Account Monitoring (Consultant/Client)
You may not need this
The role-based setup below is the strictest option, and it is more work to configure. If sharing a read-only access key is acceptable, the access-key setup above also works for third-party access and takes about five minutes. Use the role-based method here only when a security policy forbids sharing access keys.
Cross-account monitoring lets a consultant monitor a client's EC2 instances without the client sharing their AWS credentials. This is the right approach when:
- A consultant or testing engineer monitors client infrastructure
- Client wants to maintain full control over access (can revoke instantly)
- Security policies prohibit sharing AWS access keys
How it works: Client creates a read-only IAM role in their account. Consultant assumes that role using their own AWS credentials. Client can revoke access at any time by deleting the role.
| Party | AWS Account | Responsibility |
|---|---|---|
| Client | Target account (owns EC2 instances) | Creates IAM role with read-only permissions |
| Consultant | Services account (runs Load Tester) | Configures monitoring account with Role ARN |
Step 1: Client Creates IAM Role
The client performs these steps in their AWS account.
1A. Create Trust Policy
In IAM → Roles → Create role:
- Trusted entity type: AWS account
- An AWS account: Select "Another AWS account"
- Account ID: Enter the consultant's AWS account ID (e.g.,
898138143696) - External ID (optional but recommended): Agree on a shared secret string for additional security
The External ID protects against the "confused deputy" problem. Use it for production setups.
1B. Attach Permissions
Create a custom policy with these permissions and attach it to the role:
{
  "Version": "2012-10-17",
  "Statement": [
    {
      "Effect": "Allow",
      "Action": [
        "cloudwatch:GetMetricData",
        "cloudwatch:GetMetricStatistics",
        "cloudwatch:ListMetrics",
        "ec2:DescribeInstances",
        "ec2:DescribeVolumes",
        "ec2:DescribeRegions",
        "ec2:DescribeTags",
        "rds:DescribeDBInstances"
      ],
      "Resource": "*"
    }
  ]
}
Security note: All permissions are read-only. The consultant cannot start, stop, modify, or terminate any resources. The rds:DescribeDBInstances action is needed only if the consultant should monitor the client's Amazon RDS databases; omit it for EC2-only monitoring.
1C. Name the Role
Use a descriptive name like WPI-CloudWatch-ReadOnly or LoadTester-Monitoring.
1D. Share Role ARN with Consultant
After creation, copy the Role ARN from the role summary page:
Share this ARN with the consultant along with the External ID (if configured).
Step 2: Consultant Configures AssumeRole Permission
The consultant needs permission to assume the client's role.
Add AssumeRole Policy to Your IAM User
Ask your AWS administrator to add this policy to your IAM user (or add it yourself if you have permission):
{
  "Version": "2012-10-17",
  "Statement": [
    {
      "Effect": "Allow",
      "Action": "sts:AssumeRole",
      "Resource": "arn:aws:iam::CLIENT_ACCOUNT_ID:role/ROLE_NAME"
    }
  ]
}
Replace:
- CLIENT_ACCOUNT_ID with the client's AWS account ID (from the Role ARN)
- ROLE_NAME with the role name (from the Role ARN)
Example:
{
  "Version": "2012-10-17",
  "Statement": [
    {
      "Effect": "Allow",
      "Action": "sts:AssumeRole",
      "Resource": "arn:aws:iam::123456789012:role/WPI-CloudWatch-ReadOnly"
    }
  ]
}
Step 3: Consultant Configures Monitoring Account
- Open Preferences:
- Windows/Linux: Window → Preferences → Web Performance → Accounts → Amazon CloudWatch
-
macOS: Load Tester → Preferences → Web Performance → Accounts → Amazon CloudWatch
-
Click Add
-
Fill in account details:
- Name: Descriptive name (e.g., "ClientCo Production Servers")
- Access Key ID: Your AWS access key (from your services account)
- Secret Access Key: Your AWS secret key (from your services account)
- Role ARN: The client's role ARN (e.g.,
arn:aws:iam::123456789012:role/WPI-CloudWatch-ReadOnly) - External ID: The shared secret (if client configured one)
-
Regions: Check regions where client's EC2 instances run
-
Click Verify Credentials to confirm cross-account access works
-
Click OK
Step 4: Add CloudWatch Servers to Monitor
Same workflow as the access-key setup. The only difference is which monitoring account you pick in step 4.
- Open the Servers View (Window → Show View → Servers, if not already visible)
- Click Add…
- In the Monitor Server dialog, select AWS CloudWatch (EC2 instance metrics)
- Account: pick the cross-account monitoring account you configured in Step 3
- Check the EC2 instances (and any RDS databases, marked
RDS: <engine>in the Type column) from the client's account - Click OK
When you start a load test, server metrics from the client's account flow into your load test results, visible in the Servers tab.
Security & Access Control
What Cross-Account Access Provides
✅ Consultant CAN: - View CloudWatch metrics for EC2 instances - List EC2 instances and their metadata (instance ID, type, tags) - View instance state (running, stopped, etc.)
❌ Consultant CANNOT: - Start, stop, reboot, or terminate instances - Modify instance configuration - Access instance file systems or applications - Create, modify, or delete any resources - See billing information
Revoking Access
The client can revoke consultant access instantly:
Option 1: Delete the role
1. Go to IAM → Roles
2. Find the role (e.g., WPI-CloudWatch-ReadOnly)
3. Delete the role
Option 2: Modify trust policy 1. Go to IAM → Roles → [role name] → Trust relationships 2. Edit trust policy to remove consultant's account ID 3. Save
Access is revoked immediately. The consultant cannot assume the role anymore.
Temporary Credentials
When Load Tester assumes the client's role, AWS issues temporary credentials that: - Expire automatically (default 1 hour) - Are refreshed automatically by Load Tester during load tests - Cannot be used to assume other roles - Are scoped to the permissions in the role policy only
The client's access keys are never shared. The consultant authenticates with their own credentials and assumes the role. Clean separation.
Troubleshooting
| Error | Cause | Fix |
|---|---|---|
| "User is not authorized to perform sts:AssumeRole" | Consultant's IAM user lacks AssumeRole permission | Add the sts:AssumeRole policy to consultant's IAM user (see Step 2) |
| "Access denied" on Verify Credentials | Trust policy doesn't allow consultant's account | Verify the Account ID in role's trust policy matches consultant's AWS account ID |
| "Missing required permissions: cloudwatch:GetMetricStatistics, ec2:DescribeTags" | Role policy is incomplete | Update role policy with all the required permissions (see Step 1B) |
| "IAM permission validation failed for region" | Wrong region selected, or role doesn't cover that region | Verify client's instances are in selected regions; IAM roles are global but instances are regional |
| No instances discovered | Instances in different region, not running, or wrong account | Check region selection; confirm instances are "running"; verify Role ARN is correct |
| No databases discovered, or "...not authorized for rds:DescribeDBInstances" | Monitoring account's user or role lacks the RDS permission | Add rds:DescribeDBInstances to the policy (access-key or role, see Step 1B); EC2 monitoring is unaffected |
| "External ID mismatch" | External ID in Load Tester doesn't match role configuration | Verify External ID matches exactly what client configured in trust policy |
Diagnostic Steps
If CloudWatch monitoring isn't working:
- Verify IAM permissions:
- Consultant: Confirm
sts:AssumeRolepolicy is attached to your IAM user -
Client: Confirm role has all the required CloudWatch and EC2 permissions (and
rds:DescribeDBInstancesif monitoring RDS databases) -
Test role assumption manually (consultant):
Should return temporary credentials. If this fails, the issue is with IAM configuration, not Load Tester.
- Verify instances are running (client):
Confirm instances are in "running" state and in the expected region.
- Check CloudWatch agent (if monitoring memory):
- Memory metrics require CloudWatch agent installed on EC2 instances
- CPU, disk, and network metrics are available without agent
- See AWS CloudWatch Agent documentation
CloudWatch vs. WP Server Monitoring Agent
Both approaches collect server metrics, but have different trade-offs:
| Feature | CloudWatch Integration | WP Server Monitoring Agent |
|---|---|---|
| Agent installation | Not required (EC2 and RDS) | Required (any server) |
| Supported platforms | AWS EC2 and Amazon RDS | Windows, Linux (any host) |
| Number of metrics | Limited (CPU, disk, network, custom CloudWatch metrics) | Significantly more comprehensive (50+ metrics in Advanced mode: CPU details, memory breakdown, disk I/O, network stats, DB connections, thread pools, JMX, Windows perf counters) |
| Cross-account access | Built-in (IAM roles) | Not available |
| Data collection | Automatic via AWS APIs (no manual steps) | Typically requires manual file collection after test (or open firewall ports for live streaming) |
| Firewall requirements | None (uses AWS APIs) | Ports 1099/1100 for live streaming, OR manual file collection (no ports needed) |
| Cost | AWS CloudWatch API charges | Included (Basic: CPU/memory), paid upgrade (Advanced: all metrics) |
| AI analysis | ✅ Full integration | ✅ Full integration |
Use CloudWatch when: - Infrastructure runs on AWS EC2, or the application uses an Amazon RDS database - You want automatic metrics collection (no manual file retrieval) - Cross-account access is needed (consultant/client) - Basic infrastructure metrics (CPU, disk, network) are sufficient - Firewall restrictions prevent agent communication
Use WP Server Monitoring Agent when: - Servers are not on AWS EC2 (on-premise, other clouds) - You need comprehensive metrics (50+ counters including DB connections, thread pools, GC pauses, detailed memory breakdown) - You want to avoid AWS API charges - CloudWatch agent installation on EC2 is not permitted - Manual file collection after tests is acceptable
Trade-off summary: - CloudWatch: Easier setup, automatic collection, fewer metrics - WP Agent: Far more metrics (especially Advanced mode), but typically requires manual file collection from the server after each test
Both approaches integrate with WPI AI assistant for automated bottleneck analysis.
Best Practices
Region Selection
Only select regions where your EC2 instances actually run. Each selected region requires API calls to ec2:DescribeInstances, which increases credential verification time, adds to your AWS API charges (minor, but unnecessary), and clutters the instance selection dialog with empty regions.
Enable only the 2-3 regions you actually use.
Instance Tagging
Use EC2 instance tags to identify servers in the instance selection dialog:
| Tag | Purpose | Example |
|---|---|---|
Name |
Instance display name | prod-web-01 |
Role |
Server function | webserver, database, appserver |
Environment |
Deployment stage | production, staging, dev |
Load Tester displays instance tags in the selection dialog, making it easy to find the right servers.
Monitoring Account Naming
Use descriptive names that indicate:
- Client/project (for consultants): "Acme Corp Production", "ClientCo Staging"
- Environment: "Production Servers", "Staging Environment"
- Region (if multiple): "Production US-East-1", "Production EU-West-1"
Avoid generic names like "CloudWatch" or "AWS Account". Future-you will thank present-you when you're managing ten clients.
Security: External ID Usage
Always configure an External ID when setting up cross-account access for production environments. The External ID: - Prevents "confused deputy" attacks (accidental role assumption) - Acts as a second authentication factor - Can be revoked by changing it in the trust policy (forces re-configuration)
Use a randomly generated string (not a password you use elsewhere):
Related Topics
- Server Monitoring Introduction - Overview of monitoring approaches and when to use CloudWatch
- Server Monitoring Agent - Alternative agent-based monitoring for non-AWS environments
- Metrics & Counters - Understanding server metrics and their meaning
- Monitoring Through Firewalls - Firewall configuration for agent-based monitoring
- Server Performance Checklist - Systematic bottleneck identification