Browser Configuration
v7.0 captures HTTP traffic through a Chrome extension, not a proxy. In practice, this means:
- ✅ Chrome browser required (Chrome, Chrome Canary, Chromium, or Chromium-based Edge)
- ✅ One-time Chrome extension installation
- ✅ No proxy configuration needed
- ✅ No SSL certificate warnings
- ✅ Works with all websites (including localhost)
- ❌ Mobile device recording not supported (extension doesn't run on mobile browsers)
How Browser Recording Works (v7.0)
v7.0 records HTTP traffic using the Chrome Debugger API (Chrome DevTools Protocol). Here's the sequence:
- ExtensionSetupWizard prompts (first time only) to install the Chrome extension
- Install extension from
<install>/browser/chrome/directory viachrome://extensions - Load Tester detects extension is installed
- You click Record → Chrome launches with extension active
- Extension attaches debugger to browser tab
- You browse the site while extension captures all HTTP traffic via debugger API
- Recording stops → debugger detaches
First-Time Setup: Install Chrome Extension
The first time you record, Load Tester shows the ExtensionSetupWizard to walk you through installing the Chrome extension. This is a one-time setup: once installed, the extension persists across recordings.
Step 1: ExtensionSetupWizard Appears
When you click Record for the first time (or if extension is not detected), you'll see the Extension Setup wizard with three steps.
Step 2: Locate Extension Folder
Find your Load Tester installation directory, then navigate to the browser/chrome/ subdirectory:
Windows:
macOS:
Linux:
Tip: Click "Open Extension Folder" in the wizard to open this location automatically.
Verify the folder contains:
- manifest.json
- wprecorder.js
- background.js
- http-debugger-recorder.js
- http-transaction-builder.js
Step 3: Install Extension in Chrome
- Open Chrome browser
- Navigate to
chrome://extensions - Enable "Developer mode" (toggle in top-right corner)
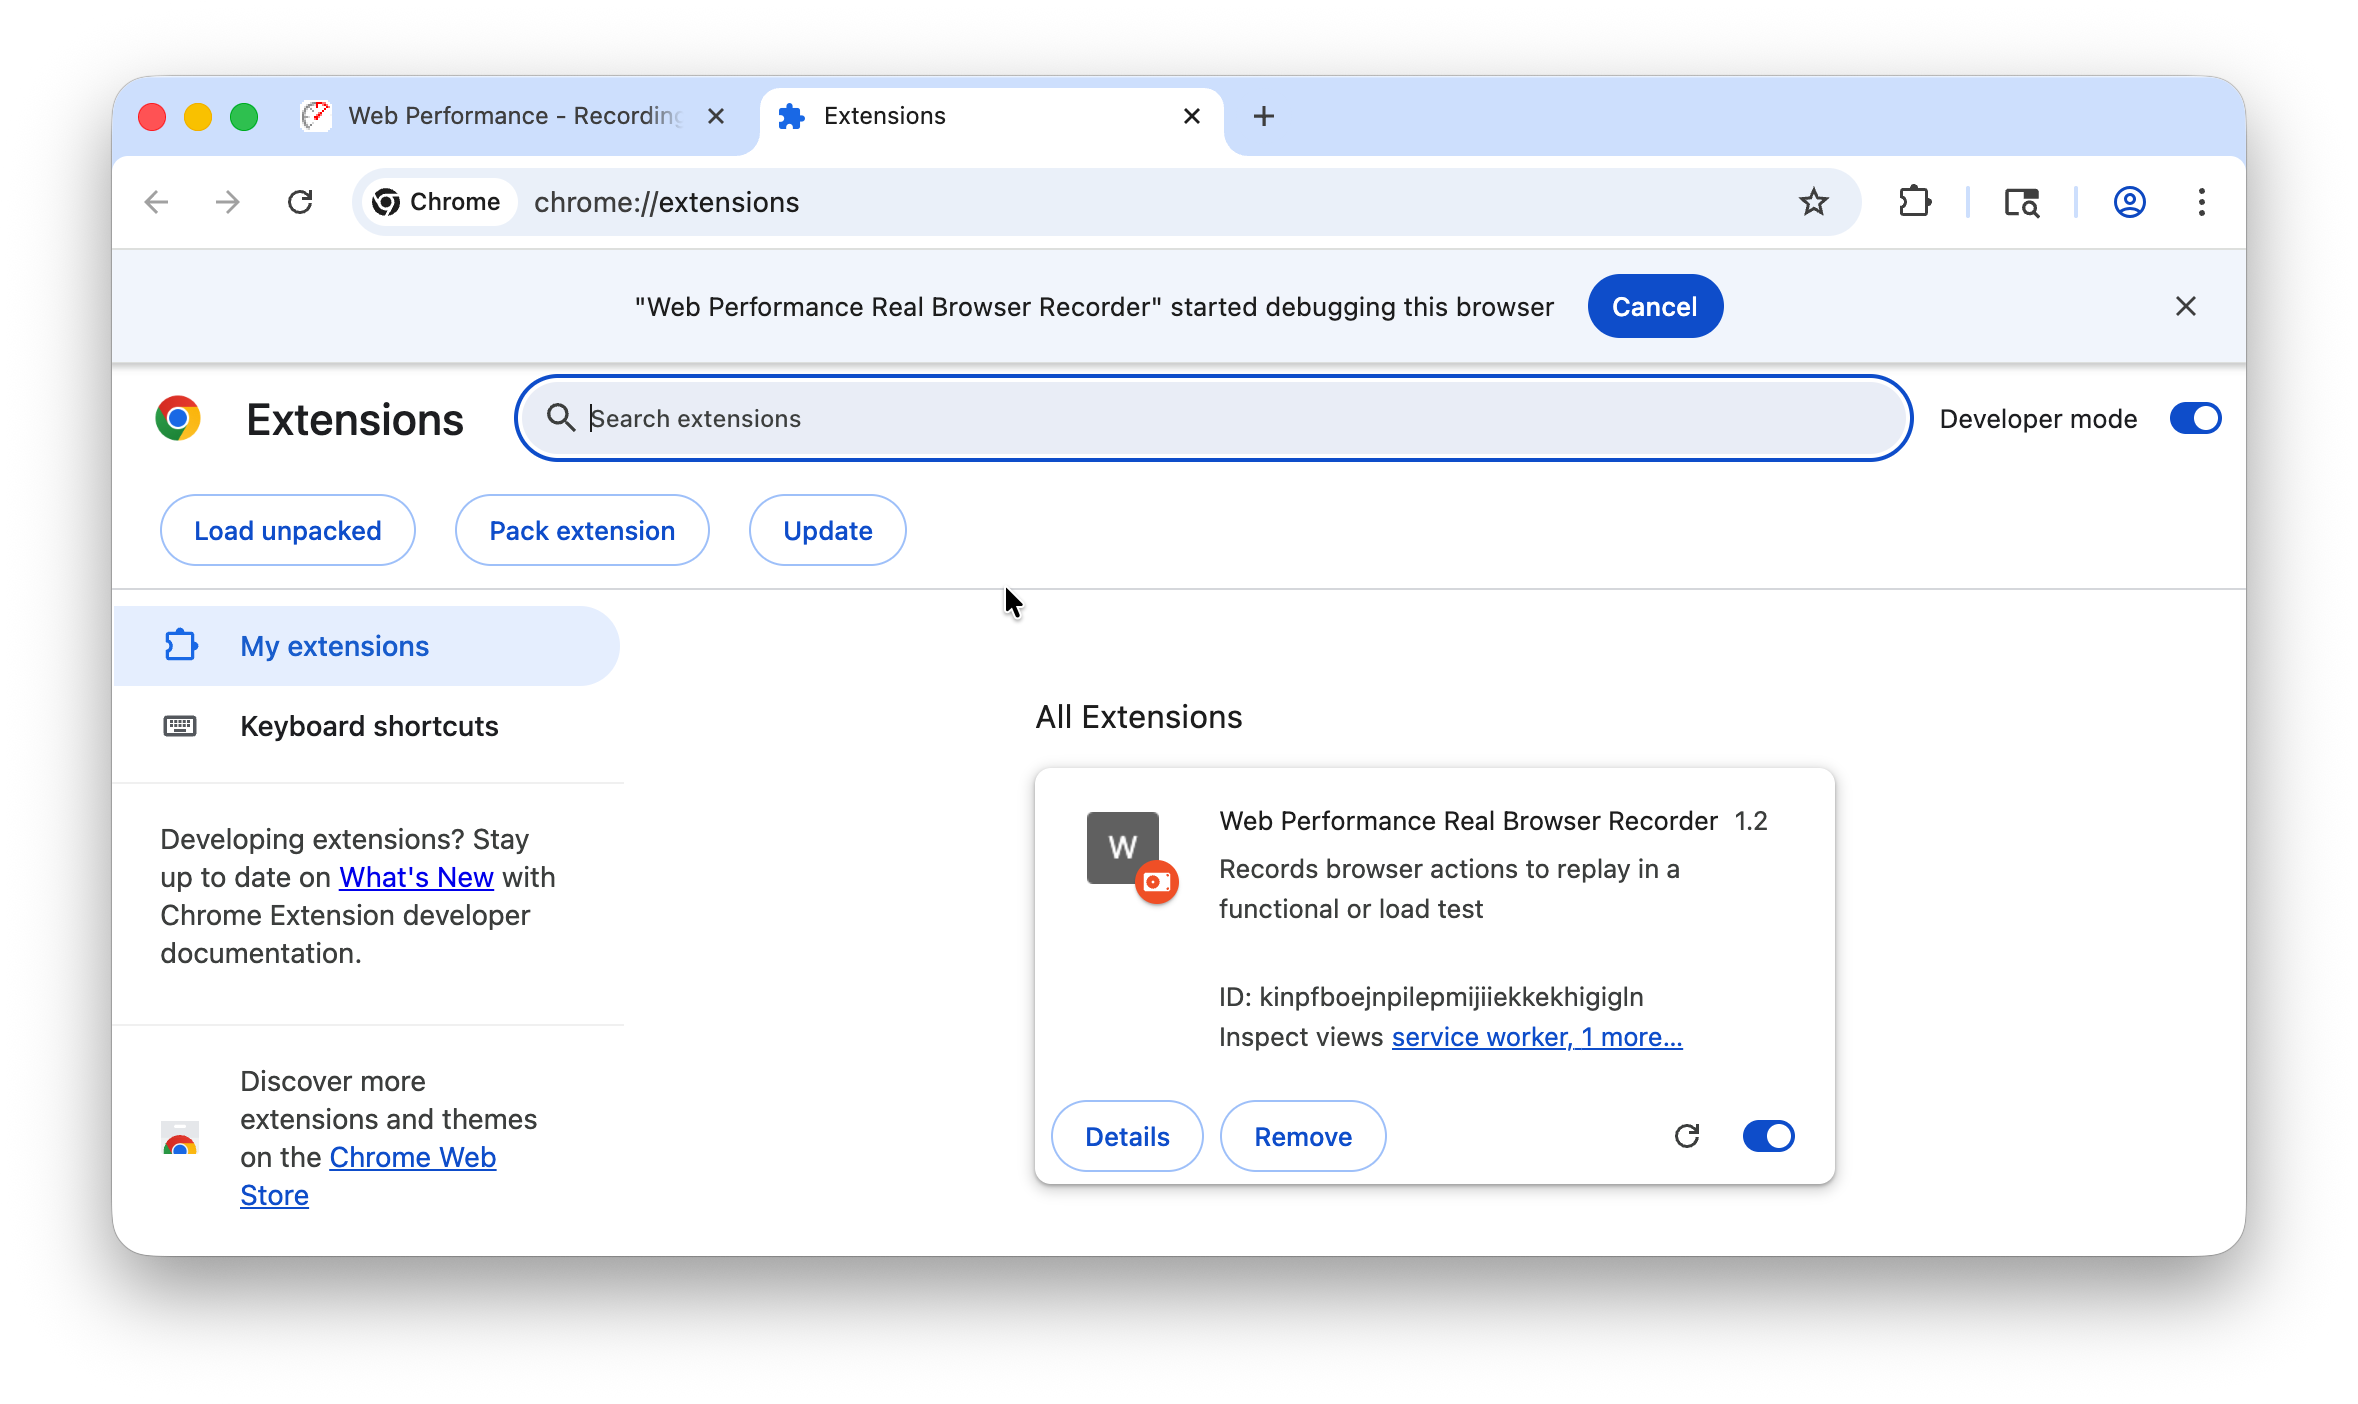
- Click "Load unpacked"
- Navigate to the
browser/chrome/folder from Step 2 - Select the folder and click "Select Folder"
- Verify "Web Performance Load Tester" extension appears in the list and is enabled
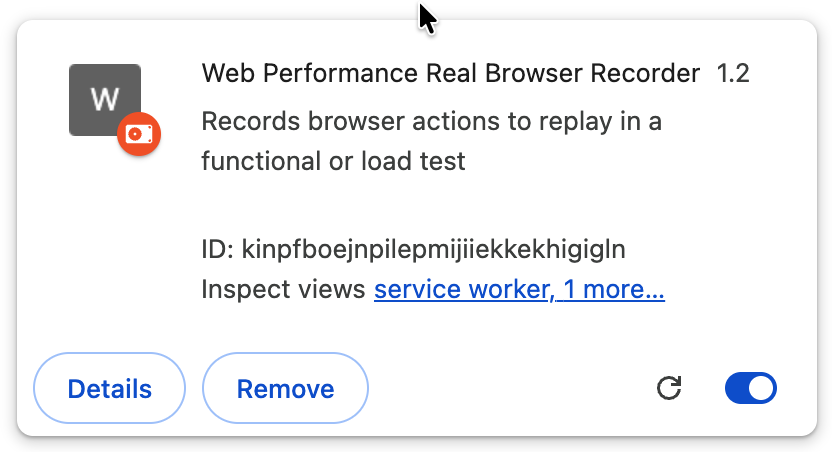
Extension should show: - Name: Web Performance Load Tester - Status: Enabled (toggle on) - Permissions: Debugger, WebRequest
Step 4: Verify Installation in Load Tester
- Return to Load Tester
- Click "I've Installed the Extension" in the ExtensionSetupWizard
- Load Tester detects the extension via
/rbi/health/endpoint - Wizard closes → You're ready to record!
If detection fails: See Troubleshooting - Extension Not Detected.
One-Time Setup
Once installed, the extension persists across Load Tester sessions. You won't see the wizard again unless you uninstall the extension or switch to a new Chrome profile.
Chrome Browser Selection
Load Tester supports multiple Chrome-based browsers. Only Chrome-based browsers work because the extension uses Chrome's debugger API, which Firefox, Safari, and other browsers don't expose.
Supported Browsers
- ✅ Google Chrome (recommended)
- ✅ Chrome Canary (beta/dev versions)
- ✅ Chromium
- ✅ Microsoft Edge (Chromium-based versions only)
- ❌ Firefox (not supported, uses different extension architecture)
- ❌ Safari (not supported, no debugger API access)
- ❌ Internet Explorer (not supported, legacy browser)
Selecting Your Default Browser
The default browser launches when you click Record. To change it:
- Window → Preferences → Web Performance → Browser
- Select a Chrome-based browser from the list
- Click "Make Default"
- Click Apply and OK
The next recording will use the newly selected browser.
Auto-Detect Browsers
Load Tester detects Chrome browsers when first launched. To pick up a newly installed browser:
- Click "Auto Detect" in Browser preferences
- Newly detected browsers appear in the list
- Select and make default if desired
Adding a Custom Chrome Installation
If you have Chrome installed in a non-standard location (custom build, portable Chrome, alternate profile):
- Click "Add" in Browser preferences
- Configure:
- Name: Enter a descriptive name (e.g., "Chrome Dev Channel", "Chrome Profile 2")
- Executable Path: Browse to
chrome.exe(Windows) orGoogle Chrome.app(macOS) - ✅ "Use Operating System-wide Proxy Settings": Leave checked (default)
- Click Apply and OK
Example paths:
- Windows:
C:\Users\[username]\AppData\Local\Google\Chrome\Application\chrome.exe - macOS:
/Applications/Google Chrome.app - Linux:
/usr/bin/google-chrome
Multiple Chrome Profiles
If you use multiple Chrome profiles, you'll need to install the extension separately in each profile. Each profile is isolated, so the extension only works in the profile where it's installed.
Browser Settings Reference
Window → Preferences → Web Performance → Browser
Default Browser
The default browser is indicated by an asterisk (*) next to the browser name. This browser launches automatically when you click Record.
Cache and Cookies
Cache and cookies are cleared automatically before each recording to ensure you capture real HTTP requests, not cache hits.
Options:
- ✅ Clear Cache: Always enabled (recommended)
- ✅ Clear Cookies: Recommended for "new user" scenarios
- Disable if testing "returning user" with existing cookies
- Disable if testing authenticated sessions with long-lived cookies
Custom browsers: If you add a custom Chrome installation, Load Tester may not be able to automatically clear cache and cookies. Clear them manually before recording:
chrome://settings/clearBrowserData- Select Cookies and other site data and Cached images and files
- Click Clear data
Continue Recording After Browser Terminates
By default, Load Tester stops recording when the browser process terminates. But if you have multiple Chrome windows open, the process may terminate while Chrome continues running in another window.
Options:
- ❌ Unchecked (default): Recording stops when browser process terminates
- ✅ Checked: Recording continues until you manually click Stop Recording
Use this option if Load Tester prematurely stops recording while Chrome is still running.
Troubleshooting Browser Configuration
Problem: "Extension Setup Required" wizard appears every time
Symptom: ExtensionSetupWizard shows every time you try to record.
Cause: Extension isn't installed, or Load Tester can't detect it.
Solution: See Recording Issues - Extension Setup Required.
Problem: "Extension not detected" after installation
Symptom: Installed extension but wizard says "Extension not detected, verify installation."
Most common causes:
- Extension installed but not enabled in
chrome://extensions - Chrome wasn't restarted after installation
- Extension installed in different Chrome profile
- Extension files corrupted or incomplete
Solution: See Recording Issues - Extension Not Detected.
Problem: "Debugger attached" warning banner in Chrome
Symptom: Chrome shows yellow warning banner "DevTools debugger is attached" during recording.
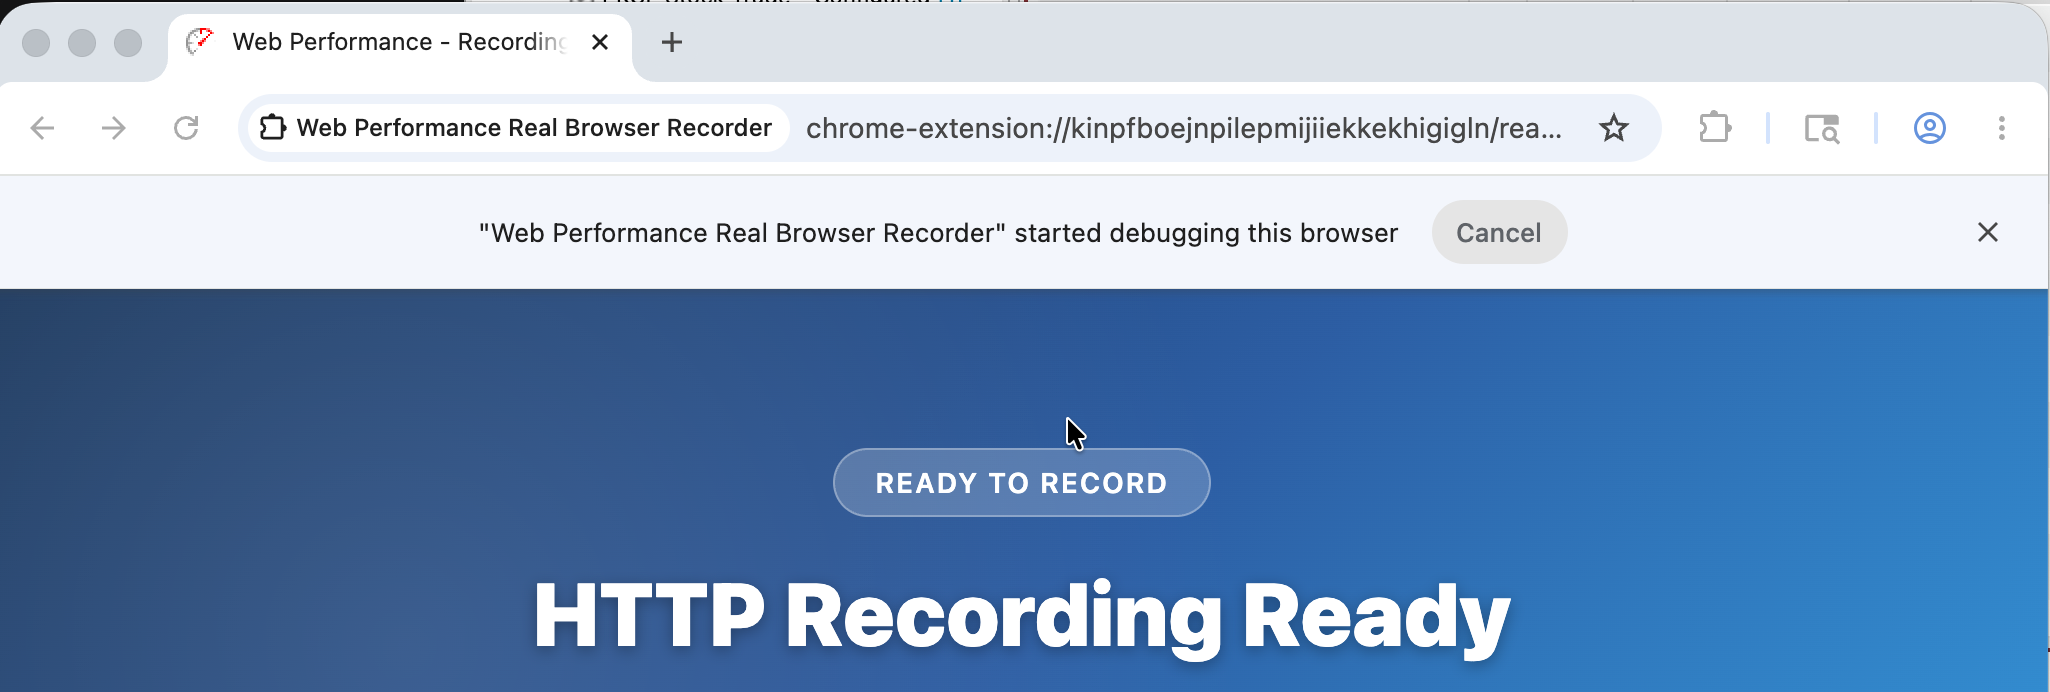
v7.0 uses Chrome's debugger API to capture HTTP traffic, and Chrome displays this banner whenever the debugger is active. It's normal and harmless:
- ✅ Does NOT affect recording quality
- ✅ Does NOT affect website behavior
- ✅ Disappears automatically when recording stops
You can minimize the banner if it's distracting, but it can't be completely disabled without breaking recording.
Problem: "Developer mode disabled" or can't enable Developer mode
Symptom: Can't enable "Developer mode" toggle in chrome://extensions.
Cause: Corporate policy or Chrome configuration restricts developer mode.
Solutions:
- Check Chrome policies: Visit
chrome://policyto see ifDeveloperToolsDisabledis set - Contact IT department: Request developer mode exception for Load Testing
- Enterprise Policy JSON (for IT): Add this to Chrome policy configuration:
- Alternative: Contact WPI support for packed
.CRXinstallation option (bypasses developer mode requirement)
Problem: Recording starts but no transactions appear
Symptom: You click Record, Chrome launches, but transactions don't appear in Load Tester as you browse.
Likely causes:
- Chrome extension not installed or not enabled
- Extension failed to attach debugger to tab
- Browser navigated to
chrome://URL (extension can't recordchrome://pages) - Recording stopped too quickly (before browser finished loading)
Solution steps:
- Verify extension installed:
chrome://extensions→ "Web Performance Load Tester" should be enabled - Check for errors: Open Chrome DevTools Console (F12) → look for extension errors
- Restart Chrome: Close all Chrome windows, reopen, try recording again
- Avoid
chrome://URLs: Don't navigate tochrome://extensionsor otherchrome://pages during recording - Wait longer: Let pages fully load before stopping recording
See: Recording Issues - Empty Test Case.
Problem: Extension folder location not found
Symptom: Wizard says "Open Extension Folder" but folder doesn't exist or can't be found.
Cause: Load Tester installation incomplete or extension files not deployed.
Solution:
- Verify installation folder: Find Load Tester installation directory
- Windows:
C:\Program Files\Web Performance\Load Tester\ - macOS:
/Applications/Web Performance Load Tester.app/ - Linux:
/opt/webperformance/loadtester/ - Check for
browser/chrome/subfolder: Should containmanifest.jsonand.jsfiles - If missing: Reinstall Load Tester; extension files may not have been deployed
- Manual path entry: If folder exists but wizard can't find it, manually navigate to
<install>/browser/chrome/inchrome://extensions
Problem: Extension not working after Chrome update
Symptom: Extension worked before, but stopped working after Chrome update.
Most common causes:
- Chrome update reset extension state
- Extension permissions changed
- Developer mode was disabled by update
Solution:
- Check
chrome://extensions: Verify extension is still enabled and has permissions - Re-enable Developer mode if it was turned off
- Reload extension: In
chrome://extensions, click reload button for "Web Performance Load Tester" - Reinstall if needed: Remove and reinstall extension from
<install>/browser/chrome/ - Update Load Tester: Extension files may need update for latest Chrome version
What About Mobile Devices?
Mobile device recording is not supported in v7.0. The Chrome extension only runs in desktop Chrome; mobile browsers (iOS Safari, Android Chrome) don't support Chrome extensions at all.
Alternatives for Mobile Testing
Option 1: Chrome DevTools Device Emulation
- Record in desktop Chrome
- Use Chrome DevTools device emulation (responsive design mode)
- Set viewport size to match target mobile device
- Use mobile user agent string
Option 2: Mobile User Agent Configuration
- Record test case in desktop Chrome
- Configure test case properties to use mobile user agent
- Set viewport/screen size to match mobile device
- Replay simulates mobile browser
See: Configuring Test Cases - Mobile User Agents for details on user agent configuration.
What About Firefox, Safari, or Other Browsers?
v7.0 recording requires Chrome (or Chrome-based browsers like Chromium or Edge). The extension uses Chrome's debugger API, which other browsers simply don't have.
Why Chrome-Only?
v7.0 switched to Chrome's debugger API because the benefits are substantial:
- ✅ No proxy configuration needed (simpler setup)
- ✅ No SSL certificate warnings (cleaner recording experience)
- ✅ More reliable HTTP capture (native browser integration)
- ✅ Better performance (no proxy overhead)
- ✅ Localhost support (no proxy bypass issues)
The trade-off is Chrome-only recording. You can't record directly in Firefox, Safari, or other browsers.
Testing with Other Browsers
If you need to simulate other browsers:
- Record in Chrome (captures HTTP transactions)
- Replay in other browsers using browser emulation:
- Set custom user agent strings to match target browser
- Configure viewport sizes to match target browser defaults
- Enable browser-specific headers (Accept, Accept-Language, etc.)
See: Configuring Test Cases - Browser Emulation for details on user agent and header configuration.
Next Steps
- Your First Recording - Record a simple test case
- Recording Settings - Domain blocking and page grouping
- Inspecting a Recording - Review captured transactions
- Recording Troubleshooting - Common Chrome extension issues
Related Topics: