Other Platforms
Load Tester can test any HTTP-based application or service. You're not limited to web browsers. This section covers specialized platforms and integrations that require unique configuration or workflow approaches.
Covered in this section:
- APM Integration (DynaTrace) - Correlate load test transactions with server-side traces
- General Platform Guidance - Approaches for custom or unlisted platforms
For common platforms, see:
- Web Services (SOAP/XML): Web Services Testing
- REST APIs: REST/API Testing
- Salesforce: Salesforce Testing
APM Integration (DynaTrace)
Application Performance Monitoring (APM) tools track server-side performance: method execution time, database queries, resource consumption. What they can't tell you is which load test transaction triggered a slow method. DynaTrace integration correlates load test transactions with server-side traces, so you can see exactly which test case transaction caused a performance bottleneck.
⚠️ Important Trade-Off: DynaTrace integration associates dataset values (like login usernames) with DynaTrace user tracking, letting you track down individual simulated users triggering errors or slow performance. However, DynaTrace metrics do NOT flow into WP Load Tester results, so WPI's AI analysis cannot see them. For AI-powered root cause analysis, use WP Server Monitoring Agent or CloudWatch integration (v7.0).
How DynaTrace integration works:
- Load Tester emits special HTTP headers (
x-dynaTrace) containing transaction metadata - DynaTrace recognizes these headers and tags server-side traces with load test context
- In DynaTrace dashboards, you see which Load Tester transaction (e.g., "Checkout - Submit Order") triggered a slow database query or CPU spike
- Track individual users: Because the
VUfield includes dataset usernames, you can identify which specific simulated user (e.g.,john.doe) triggered a problem
Example DynaTrace header:
x-dynaTrace: SN=Checkout%20Test Case;VU=john.doe;NA=Submit%20Order;
PC=Checkout.3;ID=92259fe1-be69-4edd-9928-df636433f9d5;SI=WebPerformanceLoadTester
Header fields:
| Field | Meaning | Example Value |
|---|---|---|
| SN | Test case name | Checkout Test Case |
| VU | Virtual user identity (username from dataset) | john.doe |
| NA | Transaction name | Submit Order |
| PC | Page context (page name + transaction index) | Checkout.3 (3rd transaction on Checkout page) |
| ID | Unique request ID (UUID) | 92259fe1-be69-4edd-9928-df636433f9d5 |
| SI | Source identifier | WebPerformanceLoadTester |
Enabling DynaTrace Integration
Requirements: DynaTrace integration is an optional purchase (PRO license with DynaTrace add-on).
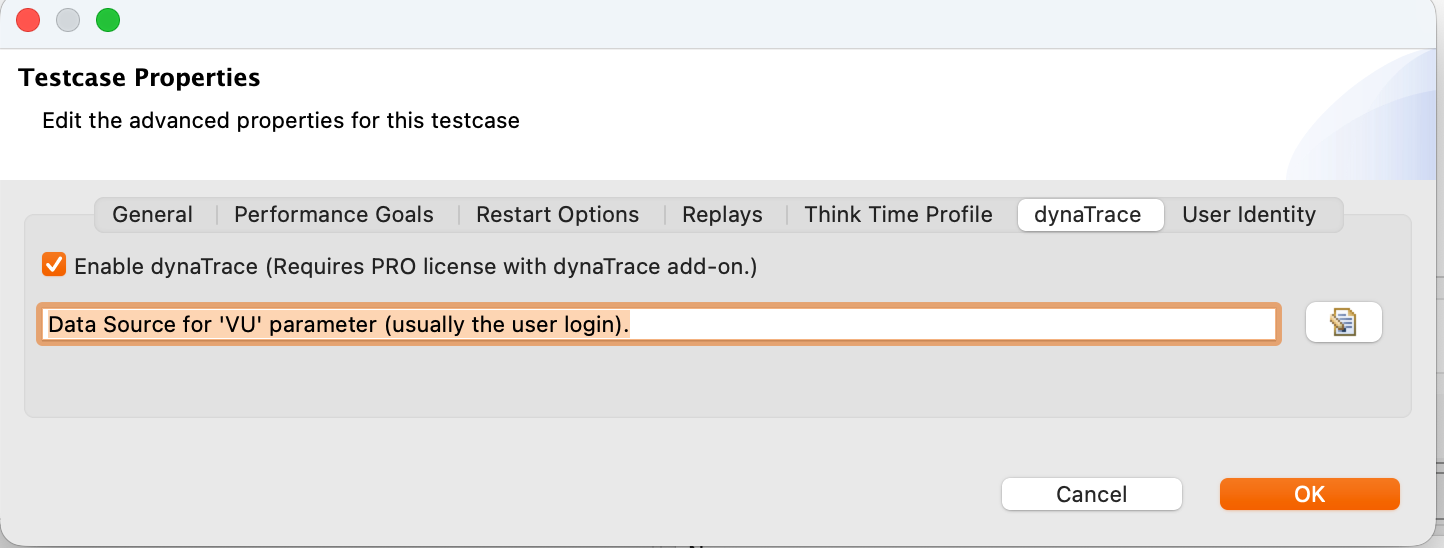
To enable DynaTrace headers for a test case:
- Right-click the test case in Navigator → Properties
- Navigate to the DynaTrace tab
- Check: Enable DynaTrace support (requires PRO license with DynaTrace add-on)
- Important: Specify a virtual user identity field (Data Source for 'VU' parameter)
- This associates dataset values (like login usernames) with DynaTrace user tracking
- If your test case uses datasets with usernames, specify which dataset column to include in the
VUfield - Example: Select
Usersdataset,usernamecolumn → DynaTrace headers will includeVU=john.doe - Why this matters: Lets you track down individual simulated users triggering errors or slow performance in DynaTrace dashboards
- Click OK
Result: All HTTP requests from this test case now include the x-dynaTrace header with transaction metadata. However, DynaTrace metrics remain in DynaTrace. They don't flow into WP Load Tester results, so WPI's AI assistant cannot analyze them.
Viewing DynaTrace Headers
To verify DynaTrace headers are being sent:
- Run a replay of the test case
- Open Headers View: Window → Show View → Headers
- Click any transaction in Test Case Editor
- View Request Headers in Headers View
- Look for the
x-dynaTraceheader - should be present on every request
Header format: The header is URL-encoded on a single line (spaces become %20, @ becomes %40, etc.).
Editing DynaTrace Headers
For advanced scenarios (custom header fields, conditional header inclusion), you can directly edit the header:
- Open Fields View: Window → Show View → Fields (or Actors View → Fields tab)
- Find the
x-dynaTraceheader - appears as a Dynamic List Insertion field type - Right-click the header → Configure Field
- Edit the header value (use Load Tester variables like
{username},{transactionName},{pageIndex}) - Click OK
When to edit DynaTrace headers:
- Adding custom fields for your APM tool
- Excluding DynaTrace headers from specific transactions (3rd-party services)
- Including additional metadata (customer ID, session type, test environment)
Other APM Tools
DynaTrace isn't the only APM tool. The same header-based approach works with:
- New Relic - Add custom headers (
X-NewRelic-Syntheticsor custom attributes) - AppDynamics - Use business transaction headers
- Datadog APM - Add trace context headers
- Custom APM - Define your own header format
To integrate with other APM tools:
- Consult your APM tool's documentation for required header format
- Add custom headers in Fields View (or Actors View → Fields tab)
- Use Load Tester variables to populate header values dynamically
- Verify headers in Headers View before running load tests
⚠️ Same trade-off applies: Custom headers let your APM tool correlate load test traffic with server-side traces, but APM metrics remain siloed. For AI-powered root cause analysis that can see server metrics, use WP Server Monitoring Agent or CloudWatch integration (v7.0).
General Platform Guidance
If your platform isn't listed (custom application, proprietary protocol, niche framework), follow this decision tree:
Is it HTTP-based?
If YES: Load Tester can test it. Follow the standard workflow:
- Record with browser (if it has a UI) - See Recording Test Cases
- Or import request/response files (if it's API-only) - See Web Services Testing
- Configure dynamic fields - See Application State Management
- Run load tests - See Configuring a Load Test
Is it a WebSocket or Server-Sent Events (SSE) application?
If YES: Load Tester records WebSocket and SSE traffic automatically during browser recording.
Configuration:
- WebSocket messages appear as separate transactions in the test case
- Dynamic message IDs or timestamps are configured via ASM (same as HTTP dynamic fields)
- Binary WebSocket frames are supported (Base64-encoded in test case)
See: Application State Management for configuring dynamic WebSocket message fields.
Is it a non-HTTP protocol (FTP, MQTT, custom TCP)?
If YES: Load Tester focuses on HTTP/HTTPS. For non-HTTP protocols:
Option 1: Capture and import request/response files
- Use network tools (Wireshark, tcpdump) to capture protocol exchanges
- Export as raw request/response files
- Import into Load Tester as transactions (similar to Web Services testing)
- Limitation: This works for simple request-response protocols, but not for complex stateful protocols
Option 2: Use protocol-specific tools
- FTP: Use dedicated FTP load testing tools
- MQTT: Use MQTT-specific load testing frameworks
- Custom TCP: Write load testing scripts using socket libraries
Load Tester is optimized for HTTP/HTTPS. If your application uses a fundamentally different protocol, you'll be better served by tools designed for that protocol.
Custom Application Patterns
Common patterns and how to handle them:
Single-Page Applications (SPAs)
React, Vue, Angular apps that use client-side routing:
- ✅ Fully supported - Load Tester records all AJAX/Fetch/XHR requests
- Configuration: Run the Configure for Replay wizard to restrict hostnames and configure dynamic JSON fields
- See: Configuring Dynamic Fields
GraphQL APIs
GraphQL endpoints that accept query/mutation requests:
- ✅ Fully supported - GraphQL uses HTTP POST with JSON payloads
- Configuration: ASM auto-detects dynamic GraphQL query variables
- Tip: Use datasets to vary GraphQL query parameters across virtual users
- See: Datasets & Data-Driven Testing
gRPC Services
gRPC uses HTTP/2 with binary Protobuf payloads:
- ⚠️ Limited support - Load Tester records HTTP/2 traffic, but binary Protobuf is difficult to modify dynamically
- Recommendation: If your gRPC service has a REST/JSON gateway, test through that instead
- Alternative: Use gRPC-specific load testing tools (ghz, k6)
Mobile App Backends
Testing the HTTP APIs that mobile apps call:
- ⚠️ Not directly supported in v7.0. The Chrome extension that drives v7.0 recording can't capture traffic from mobile devices. You have two options:
- Record the equivalent flow in desktop Chrome against the same backend API, then load-test the API. Most mobile backends are accessed by web clients too, so this covers the same endpoints.
- Capture the mobile traffic externally (Charles Proxy, mitmproxy, or your OS's network capture tool) and replay it through Load Tester via a manually constructed test case. This is significantly more work than option 1 and is rarely the right answer.
- Configuration: Once you have a recording, run the Configure for Replay wizard to configure session tokens, API keys, and other dynamic fields.
OAuth-Protected APIs
APIs requiring OAuth 2.0 access tokens:
- ✅ Fully supported - Load Tester handles OAuth flows automatically
- Configuration: Use OAuth wizard to configure token acquisition and refresh
- See: OAuth & Bearer Tokens
Ask the AI About Unlisted Platforms
If your platform isn't covered in the documentation:
I need to load test a [platform name] application. Can you help me figure out
the best approach for recording and configuring it?
The AI can:
- Determine if your platform is HTTP-based (and therefore testable with Load Tester)
- Recommend recording strategies (browser-based vs. request/response files)
- Identify platform-specific correlation challenges (dynamic fields, authentication)
- Suggest configuration approaches based on similar platforms
- Point you to relevant documentation sections
Next Steps
After testing your platform:
- Run load tests: See Configuring a Load Test
- Analyze results: See Analyzing Results
- Monitor server performance: See Server Monitoring
For configuration topics:
- Dynamic fields: Application State Management
- Authentication: Basic/Form Authentication, OAuth & Bearer Tokens
- Datasets: Datasets & Data-Driven Testing