Your First Recording
Recording is how you create test cases. You browse your application in a regular web browser while Load Tester captures every HTTP request and response, building a test case you can replay and load test later.
You browse naturally. The software figures out what matters.
Before You Start
- Know your workflow: Pick a simple, repeatable task (login → browse → logout)
- Have your data ready: Usernames, passwords, search terms, etc.
- Close other applications: Email clients, chat apps, and extra browser windows can interfere with recording
How Recording Works
Load Tester uses a Chrome extension to capture HTTP traffic via Chrome's debugger API. It sees everything: HTML pages, images, CSS, JavaScript, AJAX calls, API requests. All captured automatically.
Here's what happens:
- You click Record → Load Tester launches Chrome with the recording extension active
- Extension attaches debugger to the browser tab
- You browse your application → Extension captures all HTTP traffic via debugger API
- You click Stop → Debugger detaches, browser closes, test case is ready to inspect
First-time setup: The first time you record, you need to install the Chrome extension (one-time setup via chrome://extensions). See Browser Configuration for installation instructions.
Step 1: Start Recording
Click the Record Button
- Click the Record button in the toolbar (the red circle icon)
The Recording Configuration Wizard opens.
Configure Your First Recording
The wizard auto-detects your network settings and browser.
-
Click Next on the welcome screen
-
Select your browser (Chrome required in v7.0)
v7.0 requires Chrome (or Chrome-based browsers like Chromium or Edge Chromium). The recording extension uses Chrome's debugger API, which is not available in Firefox, Safari, or other browsers.
Load Tester detects installed Chrome browsers automatically. If Chrome isn't installed, download it from google.com/chrome.
-
Enter a test case name (e.g., "Login and Browse Products")
-
Select a repository to store the test case
Repositories are project folders that organize your test cases. "Default" is fine for your first recording.
- Optional: Choose a bandwidth profile
Leave this as "No Simulation" for now. Bandwidth simulation matters when you need to see how your application performs on slower connections, but it's not needed for your first recording.
- Click Finish to start recording
Chrome launches with the Load Tester extension active and debugger attached. A small Recording Control dialog appears on top of your browser to manage the session.
The Recording Control Dialog
The Recording Control floats above your browser for the duration of the recording. It's the only control you need while a recording is in progress.
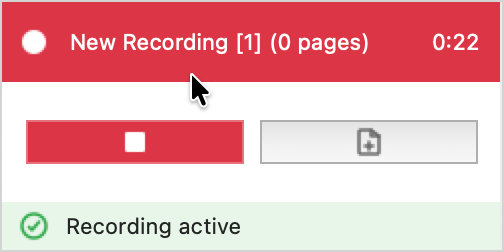
What you see:
- Title bar - Recording name, page count so far, and elapsed time
- Status row - "Recording active" while traffic is being captured
- Stop button (red square) - Ends the recording, detaches the Chrome debugger, closes the browser, and opens the captured test case
- Force Page Break button (page icon) - Starts a new page in the recording at the moment you click it, regardless of what the page-grouping algorithm would do automatically
When to Use Force Page Break
The recorder normally decides page boundaries automatically, via the referrer header or activity timeouts (see Page Grouping Algorithms). That works well for traditional multi-page sites, but it breaks down for some workflows:
- Single-page applications (SPAs) where the URL doesn't change as you navigate between "pages"
- Long-running AJAX flows where everything looks like one page to the recorder
- Workflow steps you want to measure separately that the recorder lumps together
Click Force Page Break at the moment you consider the next logical "page" to begin. The transactions that follow get grouped into a fresh page in the test case, which keeps replay timing and load-test page-level metrics meaningful.
Pause Before Forcing a Break
Wait until any in-flight HTTP requests have finished before clicking Force Page Break. Otherwise some of the previous page's tail-end transactions get pulled into the new page by mistake.
Step 2: Browse Your Application
Now the easy part: use your application normally. Load Tester watches and records everything.
What to Record
For your first recording, keep it simple:
- 3-5 pages is perfect for learning
- Start at the homepage or login page
- Complete one workflow (don't jump between unrelated tasks)
Example workflows:
- Login → view dashboard → logout
- Search for product → view details → add to cart
- Navigate to contact form → fill it out → submit
Recording Tips
Pause Between Pages
Wait 2-3 seconds between actions. Let each page fully load before clicking the next link or button. This helps Load Tester distinguish where one page ends and the next begins.
Watch the Status View (bottom left) - when it says "Ready", Load Tester is waiting for you to move to the next page. If it's still processing, wait a bit longer.
Avoid These Common Mistakes
- Don't rush through pages - Let each page finish loading
- Don't switch browser tabs - Stay in the recording window
- Don't open bookmarks or type new URLs - Only click links on the site you're testing
- Don't open other applications that generate HTTP traffic (email, chat, RSS readers)
What Gets Recorded
Load Tester captures:
- ✅ HTML pages
- ✅ Images, CSS, JavaScript
- ✅ AJAX calls and API requests
- ✅ Form submissions (POST data)
- ✅ Cookies and session information
- ✅ SSL/HTTPS traffic (automatically handled)
Load Tester does NOT capture:
- ❌ Keystrokes or mouse movements (only HTTP requests)
- ❌ JavaScript execution (it records the HTTP calls JavaScript makes)
- ❌ Browser rendering (the visual appearance)
- ❌ Client-side computation (unless it results in HTTP requests)
This is the key insight: Load Tester works at the HTTP layer, not the browser UI layer. That's how it simulates thousands of virtual users without needing thousands of actual browsers.
Step 3: Stop Recording
When you've completed your workflow:
- Click the red Stop button on the Recording Control dialog
The Chrome debugger detaches, the browser closes automatically, and Load Tester processes the recording. Your new test case opens in the Test Case Editor.
Step 4: Inspect Your Recording
After stopping, your test case opens in the Test Case Editor, showing everything that was captured.
Understanding the Editor
The editor shows a tree: pages at the top level (logical groupings of related requests), with individual transactions nested underneath (HTML, images, CSS, AJAX).
Each row shows:
| Column | What It Means |
|---|---|
| Name | URL or page title |
| Response Code | HTTP status (200 = success, 404 = not found, etc.) |
| Response Time | How long the request took during recording |
| Response Size | Bytes transferred |
Clicking Through Your Recording
Try this: Click on different pages and transactions in the tree. Watch the other views update:
- Content View (bottom) - Shows the actual page content
- Headers View - Request and response headers for the selected transaction
- Fields View - Form fields that can be configured
This is your first look at how the application actually behaves at the HTTP level, which is often quite different from how it looks in the browser.
Check for Unwanted Traffic
Look for transactions you didn't intend to record:
- Analytics services (Google Analytics, tracking pixels)
- Advertising networks
- RSS feeds or update checkers
- Resources from external domains
How to spot them: Look for domains that aren't yours. If you're testing myapp.com and you see requests to google-analytics.com, that's third-party traffic.
Should you remove them? Usually yes. You don't want your load test hammering third-party services you don't control.
How to remove: Right-click unwanted transactions → Delete. Or use Tools → Domain Blocking to block entire domains.
What Happens Next?
You've recorded your test case. Here's the complete workflow ahead:
1. Run the Configure for Replay Wizard (Next Step)
Your recording captured literal HTTP requests with specific session IDs, CSRF tokens, and cookies baked in. It also captured every third-party hostname the site happened to call out to: analytics, ads, tag managers, social widgets. Before you replay or load-test, you need to restrict the test case to your own hostnames and then configure dynamic values.
Load Tester bundles both into a single wizard called Configure for Replay, which runs automatically after recording. Page one is hostname restriction. Page two is ASM, the rules-based expert system that detects and configures:
- Session cookies (JSESSIONID, PHPSESSID, etc.)
- CSRF tokens (csrf_token, authenticity_token, etc.)
- Hidden form fields with dynamic state
- OAuth bearer tokens
- Platform-specific patterns (.NET ViewState, Salesforce tokens, etc.)
The Wizard Does the Heavy Lifting
You don't have to configure correlation by hand. ASM analyzes your recording, identifies dynamic patterns, and sets up extractors and field assignments automatically. Most test cases work after the Configure for Replay wizard with little or no manual configuration. That's the whole point.
Next topic: Understanding Web Pages & Application State explains why configuration matters. The full pre-replay walkthrough is in Run the Configure for Replay Wizard.
2. Replay to Validate
After ASM configures your test case, replay it with a single virtual user to verify it works. If one virtual user can't complete the workflow, a thousand certainly can't.
Next topic: Running a Replay
3. Run a Load Test
Once replay succeeds, run a load test with multiple virtual users. This is where you find out how your application actually performs under pressure.
Next topic: Load Test Concepts
Recording Guidelines
Follow these to create test cases that work the first time:
✅ Do This
- Pause between pages - Wait 2-3 seconds, watch for "Ready" status
- Close unnecessary applications - Avoid interfering HTTP traffic
- Use realistic data - Real usernames, valid product IDs, actual search terms
- Keep it simple - Start with 3-5 pages, not your entire application
- Complete one workflow - Don't jump between unrelated tasks
- Let pages finish loading - Don't rush ahead
❌ Avoid This
- Don't rush through pages - Load Tester needs time to distinguish pages
- Don't switch tabs or windows - Stay in the recording browser
- Don't have email/chat/RSS open - They generate interfering traffic
- Don't type URLs directly - Click links naturally
- Don't record on a slow system - Load Tester needs responsive CPU for accurate timing
Troubleshooting
Recording Won't Start - Browser Doesn't Launch
Cause: Chrome extension not installed, or Chrome browser not found.
Solution:
- Verify Chrome extension installed: Open
chrome://extensionsand check "Web Performance Load Tester" is listed and enabled - Install extension if missing: See Browser Configuration for installation instructions
- Verify Chrome browser detected: Window → Preferences → Web Performance → Browser - Chrome should be in the list
- Check if antivirus software is blocking Load Tester
Recording Shows Unrelated Traffic
Cause: Other applications are generating HTTP traffic.
Solution:
- Stop the recording
- Close email, chat, RSS readers, and extra browser windows
- Start a new recording
Recording is Too Long / Has Too Many Pages
Cause: You browsed too much during recording.
Solution:
- Delete unwanted pages: Right-click → Delete
- Or start over with a simpler workflow (3-5 pages is ideal for learning)
Some Pages Are Missing
Cause: You clicked too quickly between pages, and Load Tester couldn't distinguish them.
Solution: Re-record, pausing 2-3 seconds between pages. Watch the Status View (bottom left) for "Ready".
Common Questions
Can I edit the recording after I stop?
Yes. You can: - Delete unwanted pages/transactions (right-click → Delete) - Rename pages for clarity (right-click → Rename) - Reorder pages (drag and drop in the Editor) - Add validation rules (to verify responses contain expected content)
Do I need to record every page of my application?
No. You only need to record the workflows you want to load test. For example: - Shopping cart checkout - Login and account management - Search and browse products - API endpoints
You don't need to record every single page unless you're testing every single page.
What if my application uses AJAX heavily?
Load Tester handles AJAX automatically. It captures all XHR/fetch requests just like regular HTTP requests, and they show up as transactions in the Editor.
Load Tester doesn't execute JavaScript; it replays the HTTP requests that JavaScript generated during recording. This is far more efficient and is exactly how you simulate thousands of users without thousands of browser instances.
Can I record localhost applications?
Yes. The v7.0 Chrome extension records localhost without issues. You can record:
- http://localhost:8080
- http://127.0.0.1:3000
- http://192.168.1.100 (local network)
Just browse to your localhost URL during recording. The Chrome extension captures traffic regardless of hostname.
If you used v6.0, you may remember the proxy-based recording had localhost bypass issues. The v7.0 Chrome extension doesn't have that problem.
Should I delete analytics and ad network requests?
Usually yes. You don't want your load test hitting third-party services you don't control. Use Tools → Domain Blocking to filter them out.
Next Steps
Now that you've recorded your first test case:
- Learn why configuration matters - Understand dynamic values and application state
- Run ASM to configure your test case - Automatic correlation for session tokens, CSRF, etc.
- Replay your test case - Validate it works before load testing
Or: Continue with the Quick Start Tutorial for the complete workflow.
Related Topics: - Quick Start Tutorial - Browser Configuration - Recording Settings - Inspecting a Recording - Understanding Web Pages & Application State