The Replay View
The Replay View gives you real-time visibility into replay execution: transaction-by-transaction status, HTTP connections, and dataset row usage. This is where you watch replays succeed or fail, diagnose problems, and verify that your configuration is correct.
When to use it: During replay to catch failures as they happen. After replay to review which transactions failed and why. During debugging to inspect connection details and dataset values.
Opening the Replay View: Window → Show View → Replay (or Window → Show View → Other... → Load Tester → Replay)
Replay View Layout
By default, the Replay View shares a window pane with the Content View (bottom panel). To see both simultaneously, drag the Replay View tab to a different pane (e.g., right side) so you can watch transactions execute while viewing response content. See Navigating the UI for layout customization.
Replay View Overview
The Replay View displays replay status in a compact summary panel with detailed tabs below.
Summary Panel (Top)
The top panel shows high-level replay status:
| Field | Description | What It Tells You |
|---|---|---|
| Testcase | Name of the test case being replayed | Identifies which test case you're viewing |
| Status | Current replay state: Playing, Stopped, Paused, or Thinking (think time delay between pages) | Shows whether replay is actively executing, finished, or waiting |
| Current Page | Title and URL of the page currently being replayed (or the last page replayed when stopped) | Helps you track progress through the test case |
| Duration | Elapsed time since replay started (includes think time) | Total time replay has been running (not server response time) |
| Errors | Number of failed transactions encountered so far | Red number indicates failures. Click to see details in the Connections tab |
| Pages | Page count: current / total (e.g., "Pages: 4 of 4") | Shows how far through the test case you are |
| URLs | Transaction count: current / total (e.g., "URLs: 4 of 4") | Tracks progress within the current page |
| Tab Area | Bottom area switches between Connections, Datasets, and Variables tabs | Provides detailed debugging information for connections in flight, dataset values in use, and user-variable values with provenance |
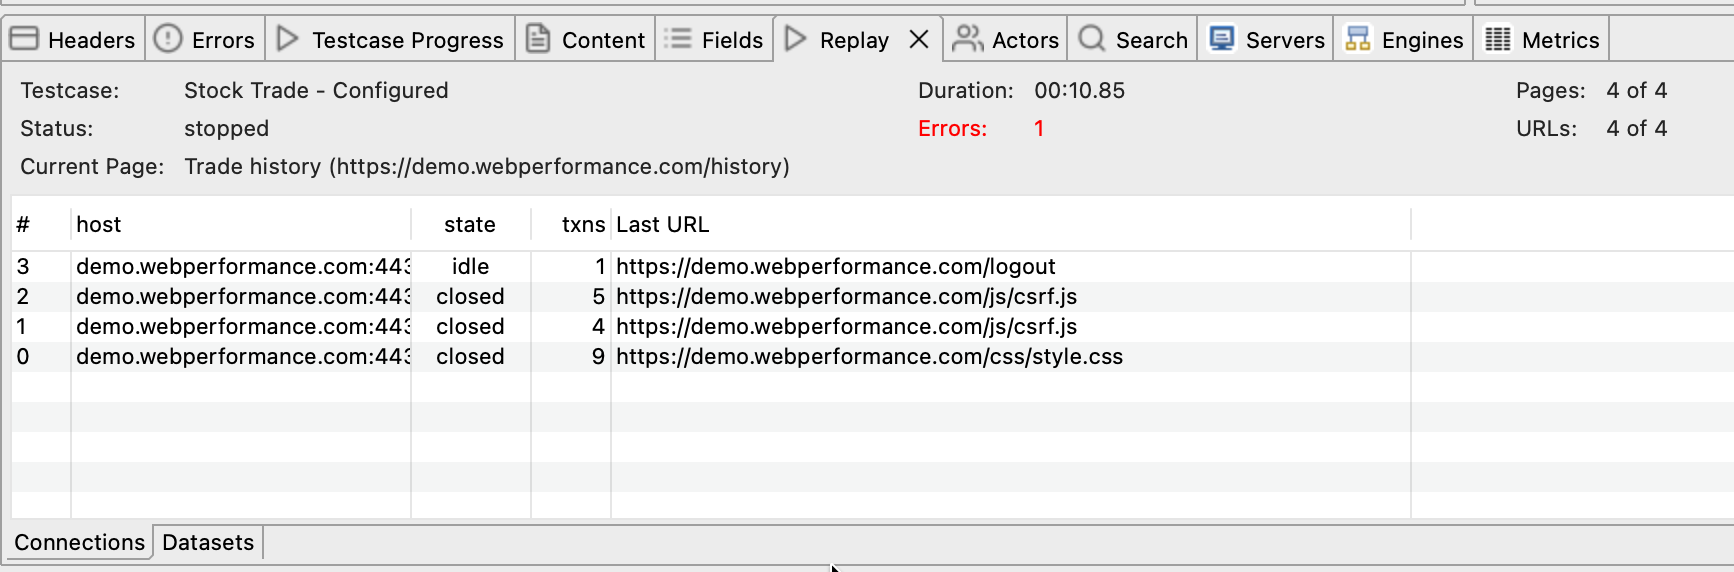
Connections Tab
The Connections tab shows every HTTP connection established during replay, including connection state, transaction count, and current activity.
Each row represents one TCP/HTTP connection to a server. Modern web applications routinely open multiple connections, both to different hosts and as parallel connections to the same host.
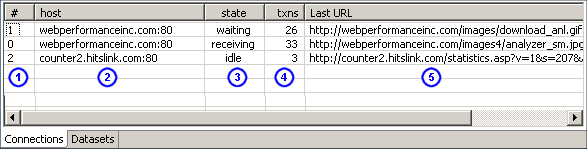
Connections Table Columns
| Column | Description | How to Use It |
|---|---|---|
| Connection # | Sequential connection number (starts at 0) | Identifies connections in diagnostic logs |
| Host Name | Server hostname or IP address (e.g., www.example.com, api.example.com) |
Shows which servers the test case connects to |
| State | Connection status: Connected, Idle, Closed, Failed | Failed indicates network problems (connection refused, timeout) |
| Transaction Count | Number of HTTP requests sent on this connection | Shows connection reuse (higher = more efficient) |
| Current URL | URL currently being requested on this connection | Identifies which transaction is in progress |
Multiple connections to different hosts is perfectly normal for modern web apps (main server, CDN, API servers). Failed connections mean the server is down, a firewall is blocking traffic, or DNS resolution failed. A low transaction count per connection may indicate connection pooling issues where the client opens too many connections instead of reusing them.
Datasets Tab
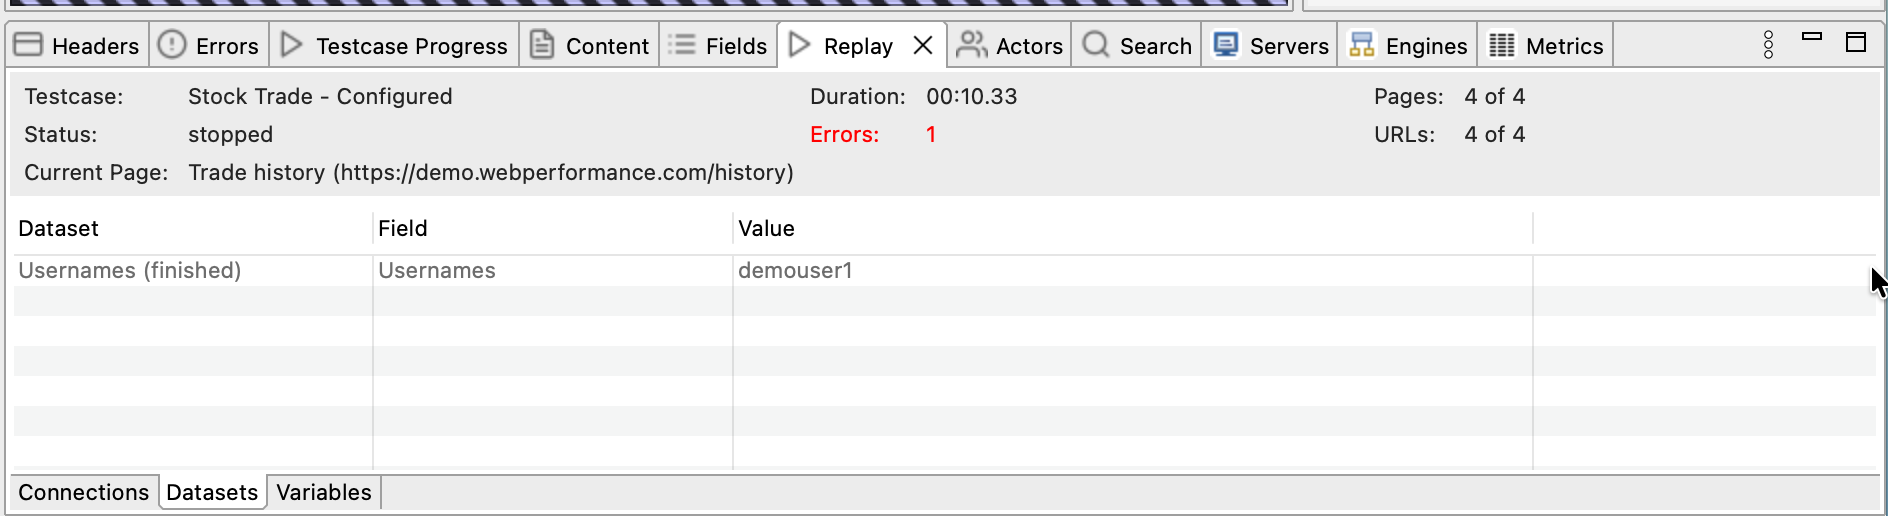
The Datasets tab shows which dataset rows are currently in use by the virtual user during replay. This helps verify that datasets are configured correctly and that the virtual user is using the expected data.
What datasets show: If your test case uses datasets (for usernames, passwords, test data, etc.), this tab displays the current row values for each dataset.
Datasets Table Columns
| Column | Description | How to Use It |
|---|---|---|
| Dataset Name | Name of the dataset (e.g., Users, Products, Credentials) |
Identifies which dataset this row comes from |
| Field Name | Column name within the dataset (e.g., username, password, productID) |
Shows which field values are displayed |
| Value | Actual value from the current row (e.g., jdoe, P@ssw0rd123, PROD-456) |
Verifies the virtual user is using correct data |
Example:
If your test case uses a dataset named Users with columns username and password, the Datasets tab might show:
This tells you the virtual user is currently using the first row from the Users dataset (or whichever row was selected based on dataset configuration).
This matters because you can verify the virtual user picked the right row, check whether the password value is what you expect (useful when debugging authentication failures), and confirm that each replay actually uses different data.
Variables Tab
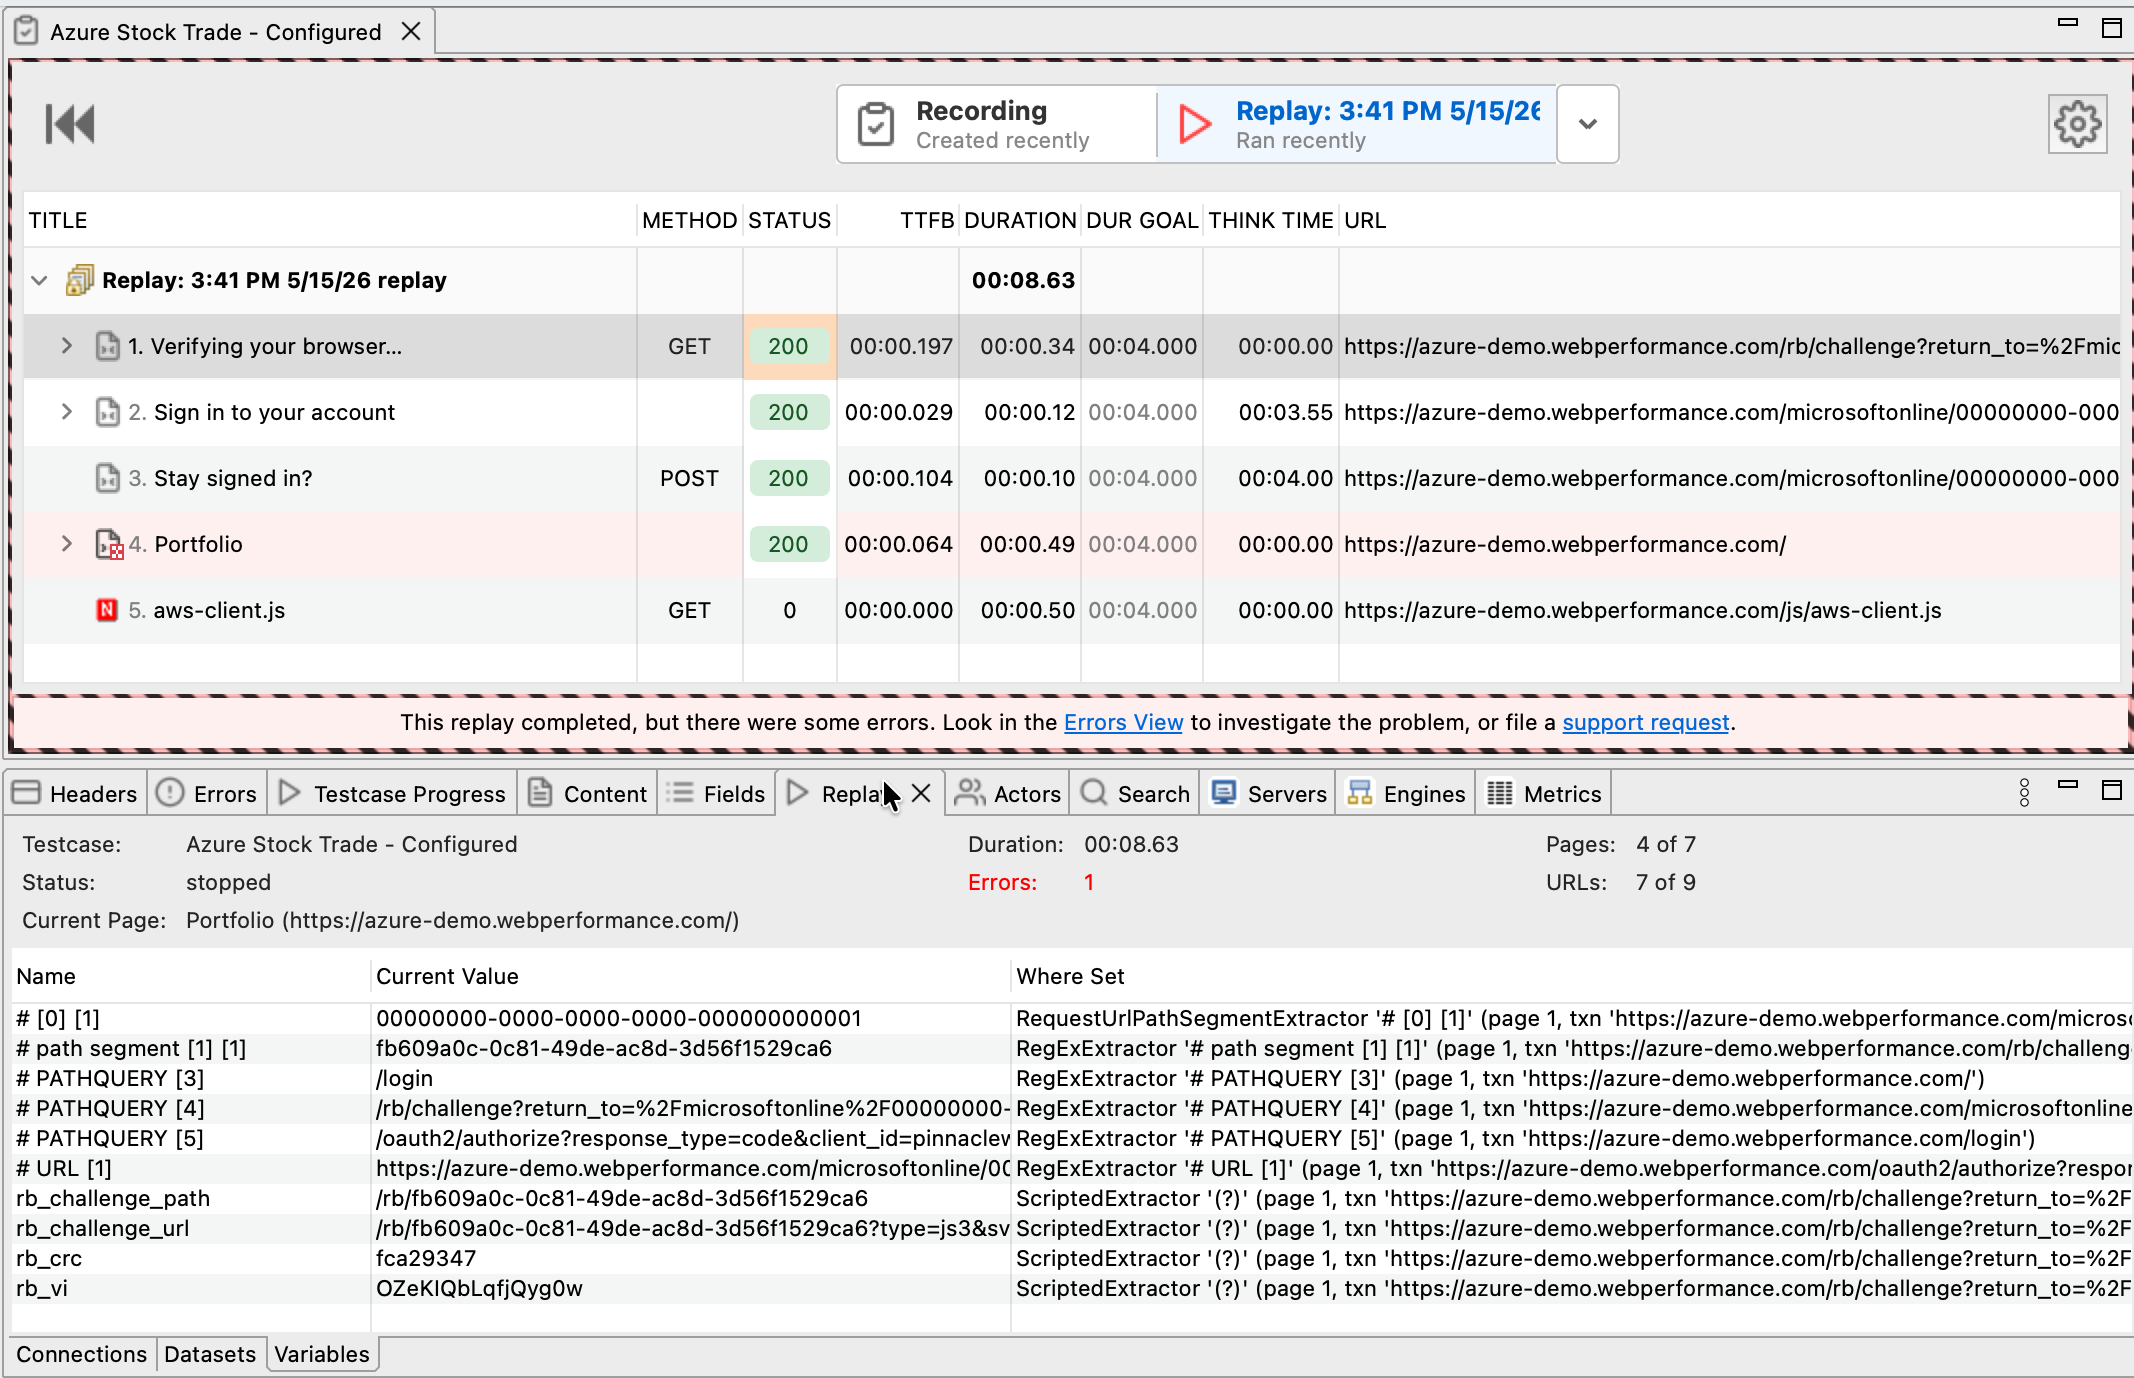
The Variables tab shows every user variable held by the virtual user and tells you exactly where each value came from. This is the answer to "what value did my extractor actually capture, and which extractor wrote it?"
User variables are the storage cells that hold dynamic values during a replay: session tokens, CSRF tokens, account IDs, anything that gets extracted from one server response and submitted on a later request. ASM creates most of them for you; you create the rest with custom extractors. Up to this tab the only way to inspect them was indirectly through the Fields View, by clicking the field they were bound into. Now you can read them directly.
Variables Table Columns
| Column | Description | How to Use It |
|---|---|---|
| Name | The variable name as configured by ASM or your custom extractor (e.g., # csrf_token [1], rb_challenge_url) |
Identifies the variable so you can match it to consuming fields |
| Current Value | The actual value the virtual user is holding right now. Long values are truncated at 200 characters; hover for the full byte length | Tells you what will be substituted into fields on the next request |
| Where Set | The extractor description, page number, and transaction URL where this variable was last assigned | Tells you exactly which extractor wrote this value and where it ran |
The Where Set column is the part that pays for the tab. A real entry looks like:
RegExExtractor '# X-App-CSRF [2]' (page 1, txn 'https://example.com/login')
That single string answers four debugging questions at once: which extractor is responsible, what kind of extractor it is, which variable it targets, and which transaction's response it ran on. If the page or transaction URL is wrong, your extractor is on the wrong response and that's why the field downstream is failing.
Live vs Post-Mortem Browsing
During an active replay the table updates as extractors fire. After replay stops, click any page in the test-case tree above and the Variables tab reseeds itself with the snapshot captured at the end of that page. So you can walk through the replay page by page and see exactly what each variable held at each step, which is the moral equivalent of how the Fields View lets you walk through field-level submissions.
If a variable never appears, no extractor produced it. If it appears with a stale or surprising value, the Where Set column tells you which extractor needs adjustment. If the value is correct but a downstream field is still failing, the bug is in the field's binding rather than the extraction.
When the Variables Tab Is Empty
The variables tab will be empty for a replay that has no ASM extractors and no custom extractors configured. That's most often a test case that has not yet had ASM run on it, or one whose pages submit only static values. Run ASM (Auto-configure → Run ASM) and replay again; the table should populate.
Menu Actions
The Replay View menu (click the down-arrow icon in the top-right corner of the view) provides dataset management options.
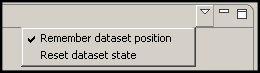
Remember Dataset Position
Default: Enabled (checked)
When enabled, Load Tester remembers which dataset row was last used and automatically advances to the next row on the next replay. This lets you replay the same test case multiple times with different data without manually resetting anything.
Example:
- Replay 1: Uses
username = "user1"(row 1 of dataset) - Replay 2: Automatically uses
username = "user2"(row 2 of dataset) - Replay 3: Automatically uses
username = "user3"(row 3 of dataset)
When to disable: When you want every replay to start at row 1, for instance if you're debugging with a specific test user and need consistent behavior.
Reset Dataset State
What it does: Immediately resets all datasets back to row 1 (first row). The next replay will start from the beginning of each dataset.
When to use:
- After running multiple replays: To go back to the first dataset row
- Before running a load test: To ensure all virtual users start from row 1
- When debugging: To replay with the same data as the first replay
How it works: Click Replay View menu → Reset Dataset State. The next replay will use row 1 of each dataset (instead of continuing from where the last replay left off).
Common Replay View Usage Patterns
Pattern 1: Watching Replay Execute in Real Time
Scenario: You want to see transactions succeed or fail as they happen.
How to use Replay View:
- Open Replay View: Window → Show View → Replay
- Start replay: Click Play (▶️) button
- Watch the Connections tab: Transactions appear as they execute
- If a transaction fails:
- Error Count field increments (shows red number)
- Failed transaction shows Failed state in Connections tab
- Click the failed transaction row to see error details
What to look for:
- ✅ All transactions show "Connected" or "Idle" state: Success
- ❌ Any transactions show "Failed" state: Investigate why (connection refused, timeout, HTTP error)
Pattern 2: Debugging Dataset Configuration
Scenario: Your test case uses datasets, and you want to verify the virtual user is using the correct data.
How to use Replay View:
- Open Replay View and select the Datasets tab
- Start replay
- Watch the Datasets tab during login or data entry transactions
- Verify:
- Is the username correct?
- Is the password correct?
- Is the virtual user using the expected row from the dataset?
If the Datasets tab is empty:
- The test case isn't configured to use datasets (no dataset modifiers configured)
- Dataset assignment might be configured for load testing only (not replays)
Pattern 3: Tracing Variable Extraction Failures
Scenario: A replay fails with "Missing user variable: # csrf_token [1]" or a downstream field is submitting the wrong value. You need to know whether the extractor fired, what it captured, and on which response.
How to use Replay View:
- Run the replay (failure expected)
- Open Replay View and select the Variables tab
- In the test-case tree above, click each page in turn. The Variables tab reseeds for each page's end-state snapshot.
- Find the page where your variable should first appear:
- Variable is missing: No extractor fired on that page. The extractor is on the wrong transaction, the prefix/suffix doesn't match, or ASM never created one. See Extractor Not Finding Value.
- Variable is present but value is wrong: The extractor matched the wrong substring. Refine the prefix/suffix or use a more specific boundary or regex extractor.
- Variable is correct but the downstream field still fails: The bug is in the field's binding, not the extraction. Open the Fields View on the consuming transaction and verify the field reads from the right variable.
- Use the Where Set column to confirm provenance: extractor type, target variable name, page number, and transaction URL. If any of those don't match your intent, that's the bug.
This pattern collapses what used to take an Errors View → Fields View → Content View loop into a single tab.
Pattern 4: Comparing Multiple Replays
Scenario: You ran replay #1, made configuration changes, and ran replay #2. You want to compare results.
How to use Replay View:
- Run first replay, note the results (errors, timing, dataset values)
- Make configuration changes (update ASM, adjust extractors, etc.)
- Run second replay
- Compare:
- Did error count decrease (configuration improved)?
- Did different dataset rows get used (Remember Dataset Position advanced the row)?
- Did connections succeed this time (server issue resolved)?
Tip: Use replay names to identify which configuration changes were applied. Right-click the replay in the Test Case Editor → Rename to give it a meaningful name (e.g., "Before ASM Fix", "After Auth Config").
Ask the AI About Replay View Interpretation
If you're unsure what the Replay View is showing or why connections are failing:
My Replay View shows several "Failed" connections. Can you help me understand
what's causing these failures and how to fix them?
The AI can:
- Interpret connection states and explain what "Failed" means in your context
- Analyze dataset values to verify correct data is being used
- Explain why error count is incrementing and which transactions failed
- Guide you through systematic debugging using Replay View data
- Compare multiple replays to identify configuration changes that improved results
Next Steps
After using the Replay View:
- If replay succeeded (no failures in Connections tab): Proceed to Configuring a Load Test
- If replay failed (errors in Connections tab): See Debugging Failed Replays
- To understand what specific errors mean: See Understanding Replay Results
- To troubleshoot specific issues: See Replay Troubleshooting
For configuration topics:
- Dataset configuration: Datasets & Data-Driven Testing
- ASM configuration: Application State Management
- Custom extractors and the Variables tab as a verification tool: Extractors & Boundary Extraction
- Authentication: Basic/Form Authentication, OAuth & Bearer Tokens