Running a Load Test
You've recorded a test case, verified it replays successfully, and configured the load profile. Now you click Run and watch virtual users stress your application.
After all the configuration work (ASM, authentication, datasets), this is where you finally get to see how your server performs under load. Response times, hits per second, bandwidth consumption: the numbers you've been preparing for.
This guide shows you:
- Pre-flight checks before starting
- How to start a load test
- What to expect during test execution
- Which views to monitor in real time
- When to stop a test early vs. letting it complete
- What happens when a test finishes
Prerequisites
Before clicking Run, verify these prerequisites:
| Prerequisite | How to Verify | Why It Matters |
|---|---|---|
| Test case replays successfully | Click Play (▶️) on test case → all transactions green | If replay fails, load test will fail (multiplied by hundreds of VUs) |
| Load configuration is correct | Review VU count, ramp rates, duration | Wrong config wastes time (test too short, too long, wrong load levels) |
| Engines are available | Open Engines View → see "Local Engine" or cloud engines | No engines = no VUs (test won't start) |
| Server monitoring configured (optional) | Open Servers View → see server metrics | Can't diagnose bottlenecks without server metrics |
Don't skip replay verification. Running a load test with a broken test case is like running a marathon with untied shoes. You'll fail before you start, and it will be painfully obvious in hindsight.
Step 1: Pre-Flight Checks
Before starting the load test, perform these quick checks to avoid wasting time on preventable issues.
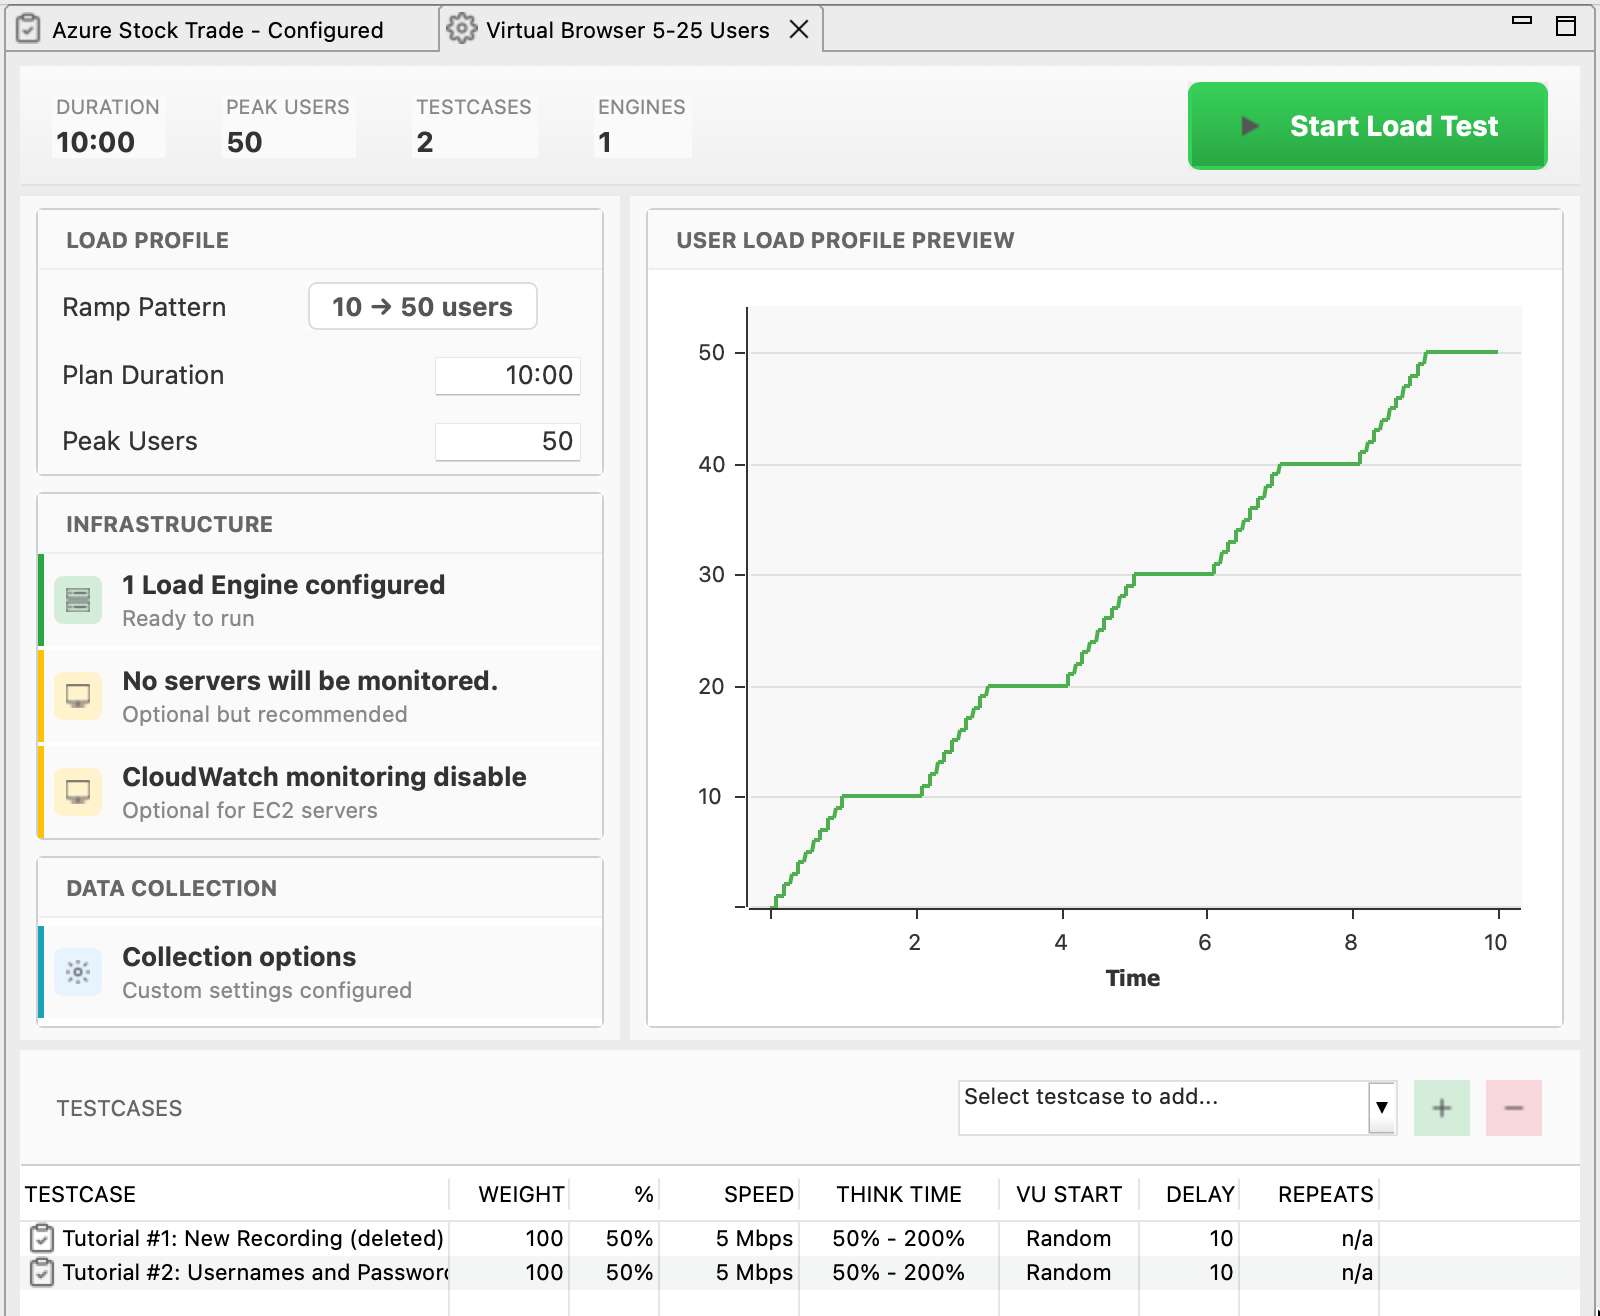
Check 1: Verify Load Configuration
- Open Load Configuration in Navigator (double-click it)
- Review settings:
- Duration: Does 60 minutes match your testing goal? (or is it accidentally set to 6 hours?)
- VU count: Does 500 VUs match your capacity expectations? (or did you mean 50?)
- Load profile: Stepped profile with appropriate ramp rates?
- Engines: Correct engines selected (cloud vs. local)?
- If anything looks wrong: Fix it now before starting
Common mistakes caught here: Test duration set to 8 hours instead of 8 minutes. Requested 5,000 VUs but only 1 engine available (engine capacity maxes out at 3,000). Cloud engines selected but AWS credentials expired. All of these are much better to discover now than 30 minutes into a test.
Check 2: Verify Engines Are Ready
- Open Engines View: Window → Show View → Engines
- Verify engines appear:
- Local engine: Shows "Local Engine" with status "Idle"
- Cloud engines: Show "Connected" (if launching new engines, this happens after clicking Run)
- Check engine capacity: Right-click engine → Properties → See "User Capacity"
If engines don't appear:
- Local engine: Tools → Preferences → Load Tester → Check "Start local engine automatically"
- Cloud engines: Will launch when test starts (if configured correctly)
Check 3: Open Monitoring Views
Before starting the test, arrange your workspace so you can monitor progress in real time:
- Open these views (if not already open):
- Load Test Results View: Window → Show View → Load Test Results (shows response times, hits/sec, VUs)
- Engines View: Window → Show View → Engines (shows engine CPU, bandwidth, VUs per engine)
- Servers View (optional): Window → Show View → Servers (shows server CPU, memory, if monitoring configured)
- Arrange views so you can see all simultaneously (drag tabs to different panes)
Arrange views before you start. Once the test is running, you'll want to watch metrics, not fumble with window layouts.
Step 2: Start the Load Test
Pre-flight checks complete. Time to start the test.
Click Run
- In Load Configuration Editor, click Run (▶️) button
- If using cloud engines: Popup appears asking "Launch X cloud engines?"
- Click Yes → Cloud engines start launching (takes 3-5 minutes)
- Click No → Test aborts
- Load Test Results View activates (switches to foreground)
What happens next: If using cloud engines, AWS instances launch and Load Tester connects to them. Load Tester distributes the test case configuration to all engines. Engines start adding virtual users according to the load profile. The Load Test Results View begins updating in real time.
What You'll See During Startup
First 30 seconds (engines initializing):
- Engines View: Engines show "Starting" → "Connected"
- Load Test Results View: Shows "Starting test..." message
- Status bar (bottom of screen): Shows "Configuring engines..."
First 1-3 minutes (VUs ramping up):
- Load Test Results View: Response times appear, hits/sec starts increasing
- Engines View: VU count increases (e.g., 0 → 10 → 20 → 50...)
- Graphs start populating: Response time graph shows first data points
After 3-5 minutes (steady state):
- Metrics stabilize: Response times settle into steady pattern
- All VUs running: VU count matches first load level (e.g., 100 VUs for stepped profile)
- You're now load testing: Server is under stress, metrics are being collected
Step 3: Monitor the Load Test
While the test runs, watch these views and metrics to ensure everything is working correctly.
Load Test Results View
This is your primary monitoring view, showing aggregate metrics across all engines and VUs.
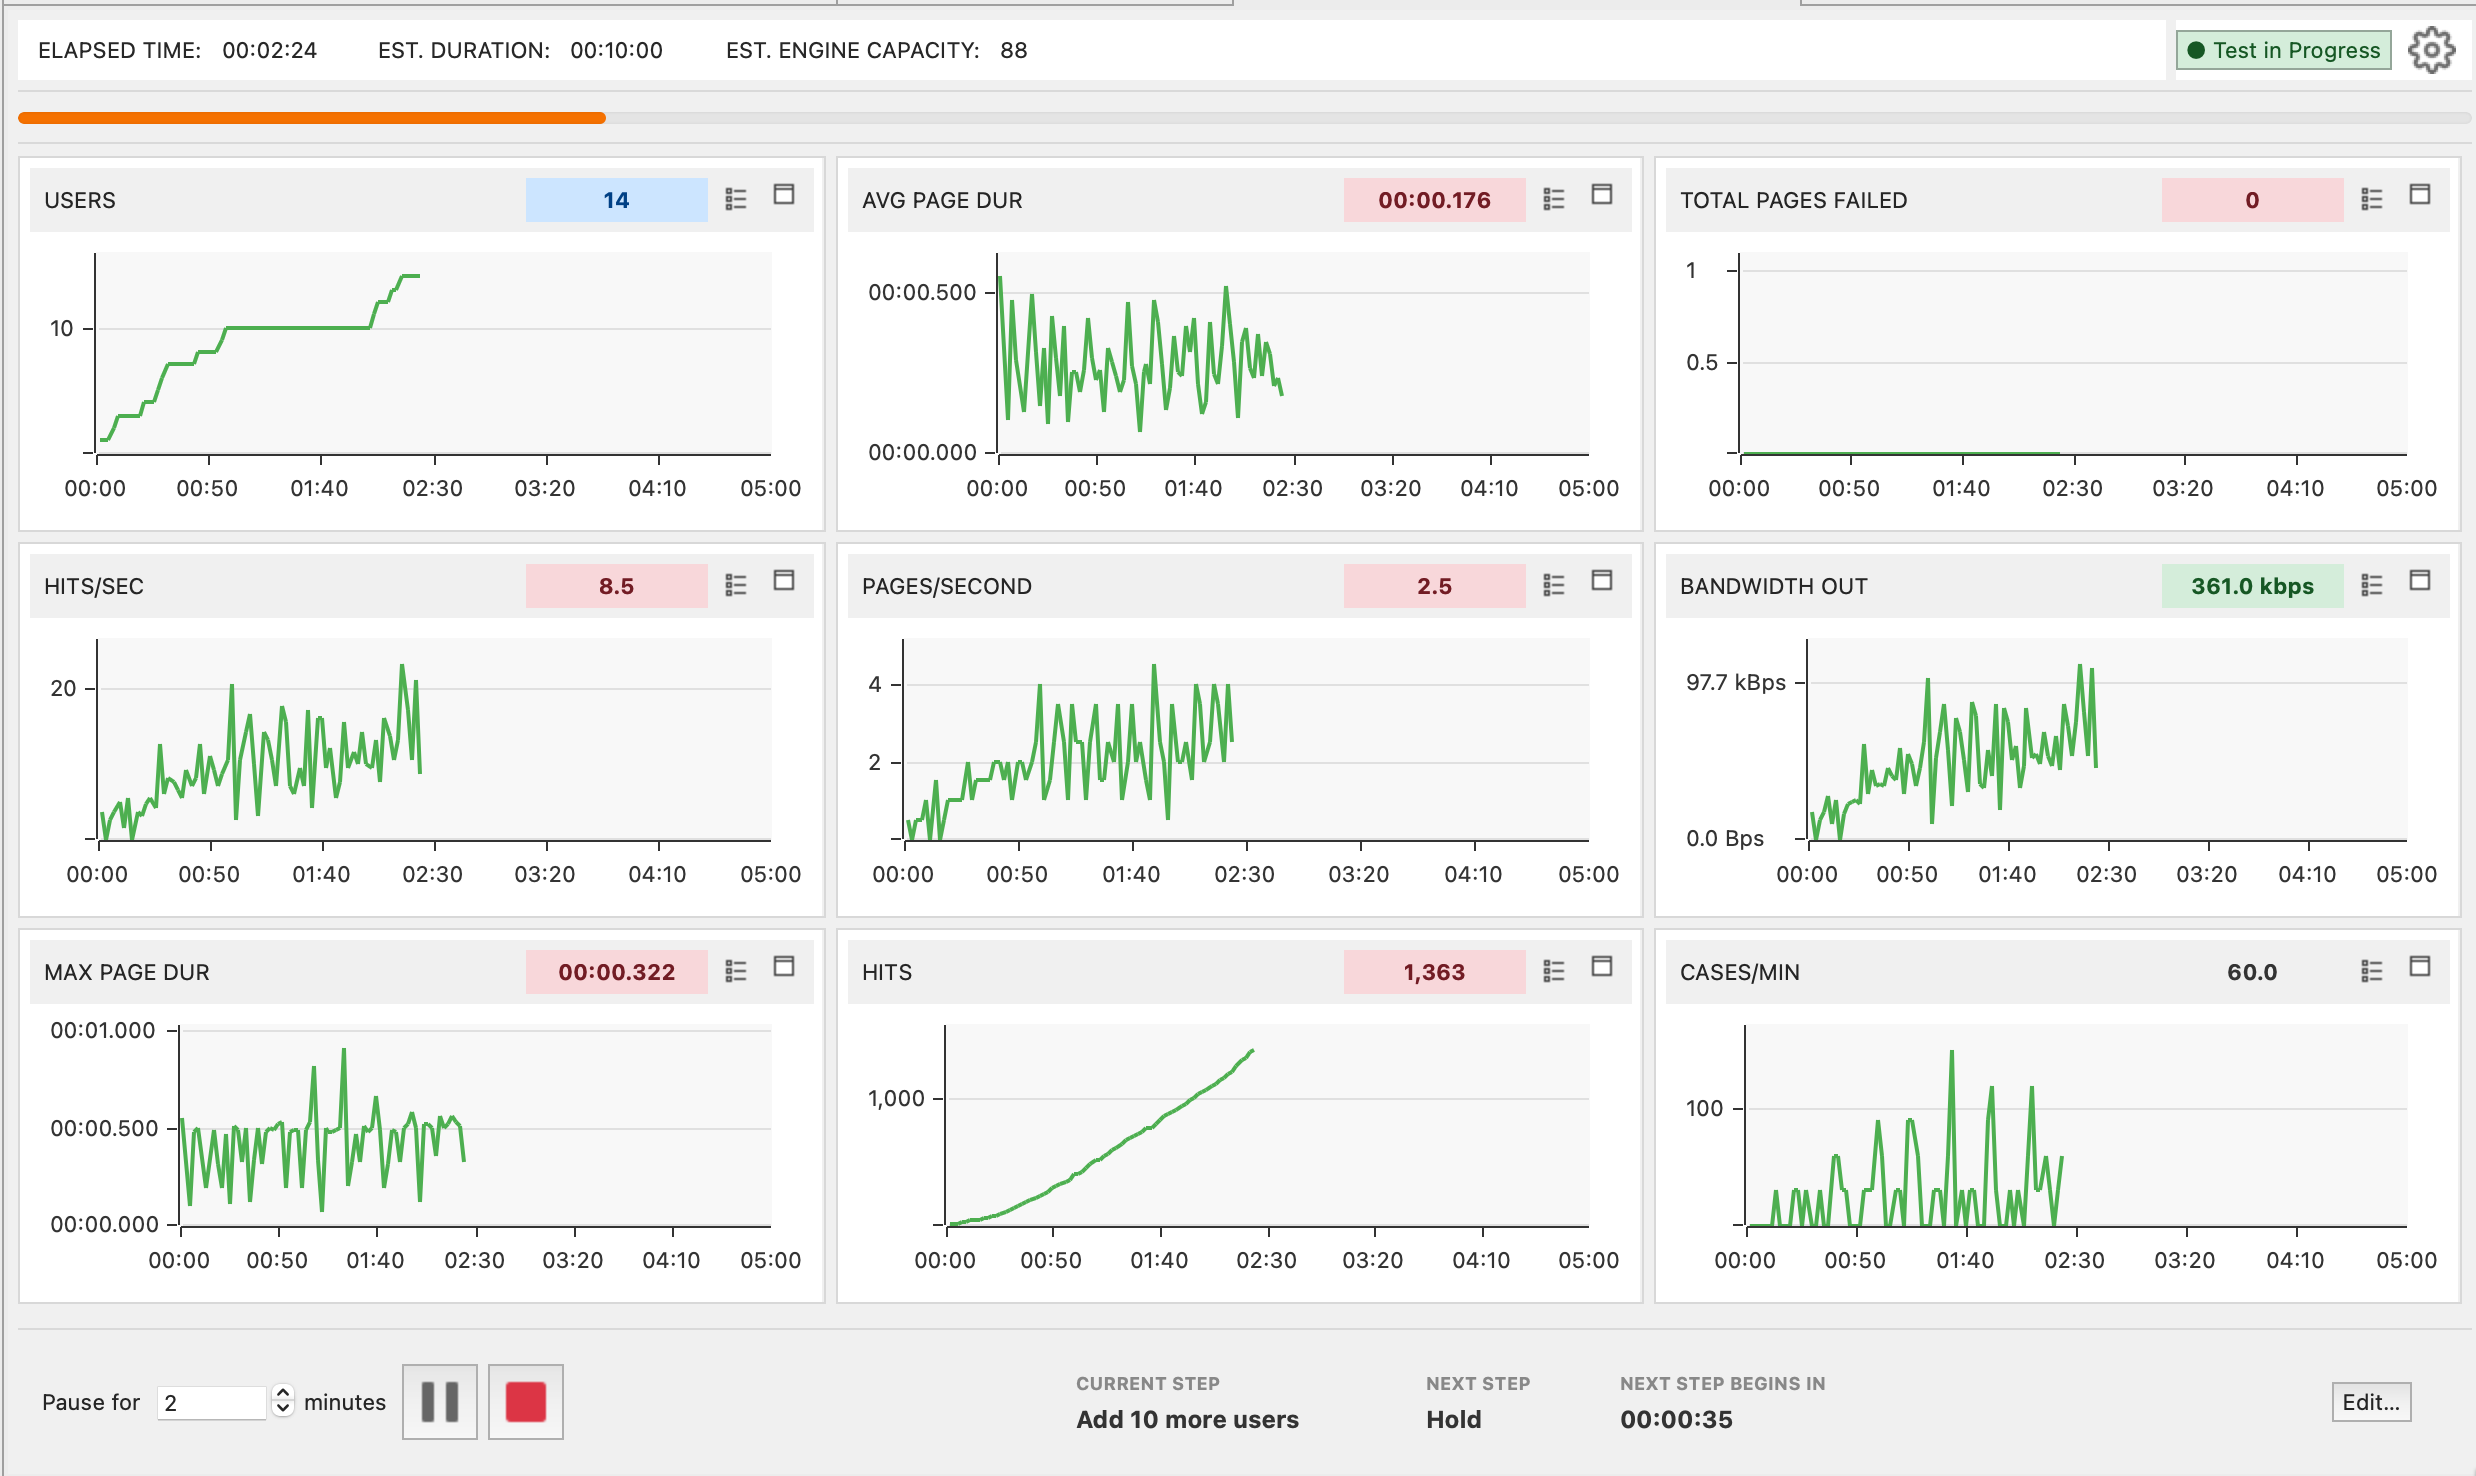
Key metrics to watch:
| Metric | What to Look For | Red Flags |
|---|---|---|
| Users | Matches the configured load profile (e.g., 100 → 150 → 200 for stepped) | Doesn't increase on schedule (engine overload or provisioning issue) |
| Avg Page Duration | Stays flat or increases gradually as users ramp | Sudden spikes (10x increase) indicate server overload |
| Max Page Duration | Reasonable headroom above the average | If max climbs into seconds while average looks fine, a small fraction of users are seeing very bad latency. Investigate. |
| Total Pages Failed | Stays at 0 | Any failures indicate test case errors (401 / 403 / 500, validation failures) |
| Hits/sec | Increases as users ramp up | Stops increasing even though users keep ramping (server saturated) |
| Bandwidth Out | Increases with users | Plateaus before user target is reached (network bottleneck at the load generator, the server, or somewhere in between) |
Avg Page Duration graph:
- Flat line: Server handling load well
- Gradual increase: Normal as load increases (e.g., 50ms → 100ms as users go from 100 → 500)
- Sharp spike: Server hit a capacity limit or encountered an error (database locked, memory exhausted, downstream service timing out)
What steady state looks like (good):
Response Time: ████████████ 150ms (flat for 5 minutes)
Hits/sec:      ███████████ 450 (matching VU count × pages/min)
Bandwidth:     ████████ 120 Mbps (consistent)
Errors:        0
What trouble looks like (bad):
Response Time: ████████████████████████ 5000ms (spiking)
Hits/sec:      ██ 50 (way too low for 500 VUs)
Bandwidth:     ████████ 120 Mbps (same as before, but VUs doubled)
Errors:        ████ 45 errors/sec
Engines View
Monitor engine health to ensure engines aren't the bottleneck (you're testing the server, not the engines).
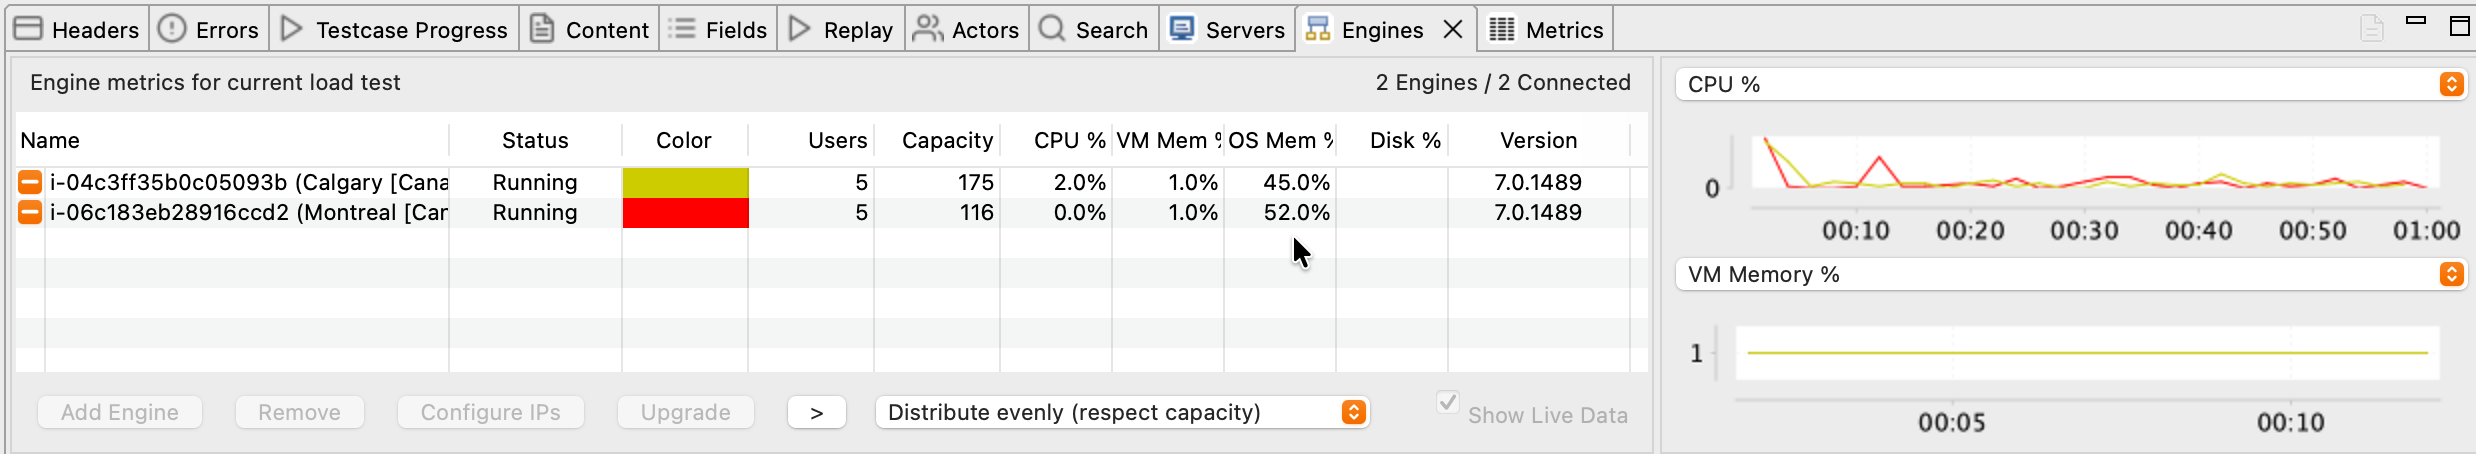
Key metrics to watch:
| Metric | What to Look For | Red Flags |
|---|---|---|
| CPU % | < 70% | > 90% (engine is overloaded, may self-regulate) |
| Bandwidth | < 70 Mbps per engine | > 90 Mbps (bandwidth bottleneck) |
| Virtual Users | Evenly distributed across engines | One engine has 90% of VUs (load imbalance) |
| Status | "Running" | "Warning" or "Overloaded" |
What good engine health looks like (3 engines):
| Engine | VUs | CPU | Bandwidth | Status |
|---|---|---|---|---|
| Engine 1 | 167 | 45% | 35 Mbps | Running |
| Engine 2 | 167 | 47% | 38 Mbps | Running |
| Engine 3 | 166 | 44% | 33 Mbps | Running |
Balanced load, no overload, plenty of headroom.
What engine overload looks like (bad):
| Engine | VUs | CPU | Bandwidth | Status |
|---|---|---|---|---|
| Engine 1 | 500 | 95% | 89 Mbps | ⚠️ Warning |
This engine is the bottleneck, not the server. Test results are invalid. You need more engines.
Servers View (If Server Monitoring Configured)
Monitor server-side metrics to identify bottlenecks (CPU, memory, database).
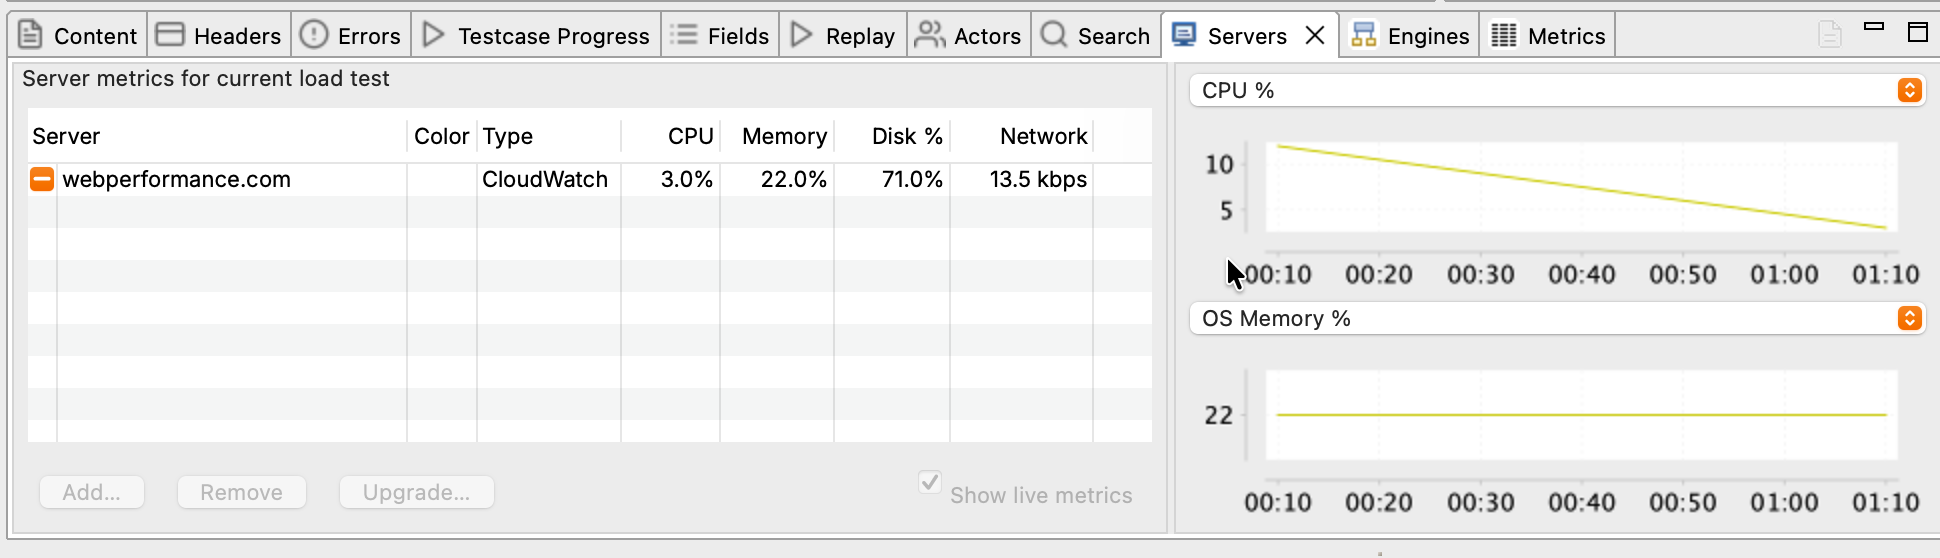
Key metrics to watch:
| Metric | What to Look For | What It Means If High |
|---|---|---|
| CPU % | < 80% | CPU-bound (slow code, inefficient queries) |
| Memory % | < 90% | Memory leak or insufficient RAM |
| Disk I/O | < 80% | Database slow, disk bottleneck |
| Network I/O | < 80% | Network bandwidth limit reached |
Correlating server metrics with response times:
- Response times increase AND server CPU hits 100% → CPU bottleneck (optimize code, add CPU capacity)
- Response times increase AND server memory hits 100% → Memory bottleneck (fix memory leak, add RAM)
- Response times increase AND disk I/O hits 100% → Database bottleneck (optimize queries, add indexes, faster disks)
See: Server Monitoring for detailed server metrics interpretation.
Step 4: What to Expect at Each Stage
Load tests have distinct phases. Understanding what happens at each phase helps you know if the test is progressing normally.
Phase 1: Startup (First 1-3 Minutes)
What's happening:
- Engines connect to Load Tester
- Test case configuration is sent to engines
- First VUs start executing test case
- Metrics begin appearing
What you'll see:
- Engines View: Engines appear, status changes to "Running"
- Load Test Results View: First response times appear (may be slower than expected due to cache warmup)
- VU count: Increases from 0 to first load level (e.g., 0 → 100 for stepped profile)
Normal behavior: First requests may be slow (200-500ms) even if the server is fast, because caches are cold and database connections are initializing. The VU ramp may pause briefly as engines initialize, and metrics may be choppy for the first sample period while engines synchronize clocks.
Don't panic if the first minute or two looks weird. Metrics stabilize after the first load level completes.
Phase 2: Ramp-Up (Stepped/Exponential Profiles)
What's happening:
- VUs are added at intervals (e.g., +50 VUs every 5 minutes)
- Server load increases incrementally
- Response times may increase as load increases
What you'll see:
- VU count increases in steps (e.g., 100 → 150 → 200 → 250)
- Response times may increase (50ms @ 100 VUs → 80ms @ 200 VUs → 150ms @ 400 VUs)
- Hits/sec increases (more VUs = more requests/sec)
Normal behavior: Response times increase gradually, maybe 10-20% per load level. Server metrics increase proportionally (CPU climbs from 30% to 50% to 70% as VUs increase).
When to worry: Response times jump 10x in a single ramp (50ms to 5,000ms), which means the server hit a hard limit. Errors appear where there were none (0 errors to 50 errors/sec). VUs stop ramping and stick at 200 even though the config says 500, which means the engines are overloaded.
Phase 3: Steady State (Between Ramps or Constant Load)
What's happening:
- VU count is constant (no ramping)
- Load Tester collects metrics for analysis
- This is where you gather the most useful data
What you'll see:
- Metrics stabilize: Response times, hits/sec, bandwidth stay relatively flat
- Graphs show steady patterns: Response time graph is flat or shows consistent pattern
Normal behavior: Metrics stay consistent for the entire steady-state period (5 minutes at 200 VUs, say). Small variations of plus or minus 10% are normal: network jitter, background processes.
Ideal steady state (what you want to see):
This is gold. Clean data showing the server handles 200 VUs comfortably.
Phase 4: Peak Load (Final Load Level)
What's happening:
- All VUs are running (peak concurrency)
- Server is under maximum stress
- Performance may degrade or stabilize
What you'll see:
- VU count at maximum (e.g., 500 VUs for a 500-VU test)
- Response times either stable or degrading (depends on server capacity)
- Server metrics at peak (CPU, memory, bandwidth all higher than earlier phases)
Three possible outcomes. The server handles it fine: response times stay under 2 seconds, no errors, and the server has capacity to spare. The server struggles: response times climb to 2-5 seconds with occasional errors, meaning you're at or near the capacity limit. Or the server breaks: response times exceed 10 seconds, errors multiply, timeouts appear. You found the ceiling.
Phase 5: Test Completion
What's happening:
- Test duration expires (or user stops test)
- VUs finish current iterations and shut down
- Final metrics are collected
- Test results are saved
What you'll see:
- VU count decreases to 0 (over 10-30 seconds as VUs complete current pages)
- Response times shown for final requests
- Status changes to "Completed"
- Popup appears: "Terminate cloud engines?" (if using cloud engines)
Post-test actions:
- Terminate cloud engines (if applicable) → Click Yes to avoid continued AWS charges
- Review results in Load Test Results View
- Generate reports for detailed analysis
When to Stop a Test Early
Most tests should run to completion, but sometimes stopping early saves time and money.
Stop the test immediately if:
| Condition | Why Stop | How to Stop |
|---|---|---|
| Massive errors (> 50% error rate) | Test case broken, no valid data being collected | Click Stop (⏹️) button |
| Engine overload warnings | Engines are the bottleneck, not the server (invalid results) | Stop, add more engines, restart |
| Server crashed | No server to test | Stop (server team needs to investigate) |
| Wrong configuration | Realized test duration is 8 hours instead of 8 minutes | Stop, fix config, restart |
Continue the test if:
| Condition | Why Continue | Notes |
|---|---|---|
| Some errors (< 5% error rate) | May be transient issues worth investigating post-test | Document which VU level triggered errors |
| Response times increasing | This is useful data (shows capacity limit) | Let test complete to see full degradation curve |
| Server metrics high (80-90% CPU) | This is the point of load testing | Continue to see if server sustains or crashes |
To stop a test:
- Click Stop (⏹️) button in Load Test Results View
- VUs shut down (may take 10-30 seconds)
- Confirm: "Terminate cloud engines?" → Click Yes
Unattended Runs
For unattended load testing (nightly regression, weekend soak tests, CI/CD pipelines), use the command-line interface plus an OS-level scheduler (cron, Task Scheduler, or your CI runner). The CLI is the supported path for automation. Load Tester does have an in-app delayed-execution option, but it requires the application and a specific dialog to stay open for the schedule to fire, so it is not a practical replacement for OS-level scheduling.
Troubleshooting During Load Tests
Problem: VUs Not Ramping as Expected
Symptom: Load profile configured for 500 VUs, but test stops adding VUs at 300.
Cause: Engine self-regulation: engines detected overload (CPU > 90% or memory exhausted) and stopped adding VUs.
Diagnostic steps:
- Check Engines View → Look for "Warning" or "Overloaded" status
- Check engine CPU % → If > 90%, engines are the bottleneck
- Check engine bandwidth → If near 100 Mbps, bandwidth bottleneck
Fixes:
- Add more engines: Distribute VUs across more engines to reduce per-engine load
- Reduce VU target: Lower max VUs to match engine capacity
- Increase ramp interval: Add VUs more slowly (every 10 min instead of 5 min) to give engines time to stabilize
Problem: Response Times Suddenly Spike to 30+ Seconds
Symptom: Response times were 100ms, suddenly jump to 30,000ms (30 seconds).
Cause: Server hit a hard limit (database connection pool exhausted, memory full, deadlock).
Diagnostic steps:
- Check Errors View → See if specific error messages appeared
- Check Servers View → See if server CPU/memory/disk spiked
- Check server logs → Look for exceptions, timeouts, deadlocks
Immediate action: Don't stop the test yet (unless errors hit 100%). See if the server recovers or continues degrading. Note the VU count when the spike occurred ("200 VUs was fine, 250 VUs caused the spike").
This is valuable data. You found the capacity limit.
Problem: Test Results View Shows "No Data"
Symptom: Test is running (VUs shown in Engines View), but Load Test Results View shows no graphs or metrics.
Cause: Sample period too long. If sample period is 5 minutes but test duration is 2 minutes, no samples are collected.
Fix:
- Stop the test
- Edit load configuration → Change sample period to 15 seconds
- Restart test
Ask the AI to Monitor Your Load Test
If you're unsure what metrics mean during a live test:
My load test is running and response times just jumped from 100ms to 5000ms
at 300 VUs. What does this mean and should I stop the test?
The AI can:
- Interpret response time patterns and spikes in real time
- Explain what VU ramp behavior means (normal vs. engine overload)
- Recommend whether to stop a test early or let it complete
- Correlate engine metrics with server metrics to identify bottlenecks
- Suggest immediate fixes for mid-test issues (add engines, adjust ramp rates)
- Help you understand what "normal" looks like for your specific test
Next Steps
After the load test completes:
- Analyze results: See Analyzing Results
- Generate reports: See Reports
- Review server performance: See Server Monitoring
If you need to re-run the test:
- Fix configuration issues: See Configuring a Load Test
- Add more engines: See Cloud Load Testing
- Adjust test case: See Debugging Failed Replays
For monitoring guidance:
- What to watch during tests: See Monitoring During a Load Test
- Understanding metrics: See Understanding Metrics