Running a Replay
After recording a test case, the next step is replay: executing it with a single virtual user to verify it works correctly. Replay proves your test case can run before you scale to hundreds or thousands of users in a load test.
Think of it as a dress rehearsal before the performance.
Why Replay First?
Don't skip this step. Running a successful replay saves time and frustration later. If your test case doesn't work with one user, it definitely won't work with 1,000 users.
What Replay Does
Replay simulates a person using a browser to interact with your application. The pages visited are defined by your recorded test case. For each page, Load Tester sends HTTP requests to the server, extracts dynamic values (session cookies, CSRF tokens) from responses, injects those values into subsequent requests, validates that responses contain expected content, and records timing for each transaction.
Key difference from recording: During recording, you controlled the browser. During replay, Load Tester drives the HTTP requests directly. No visible browser.
Before Your First Replay
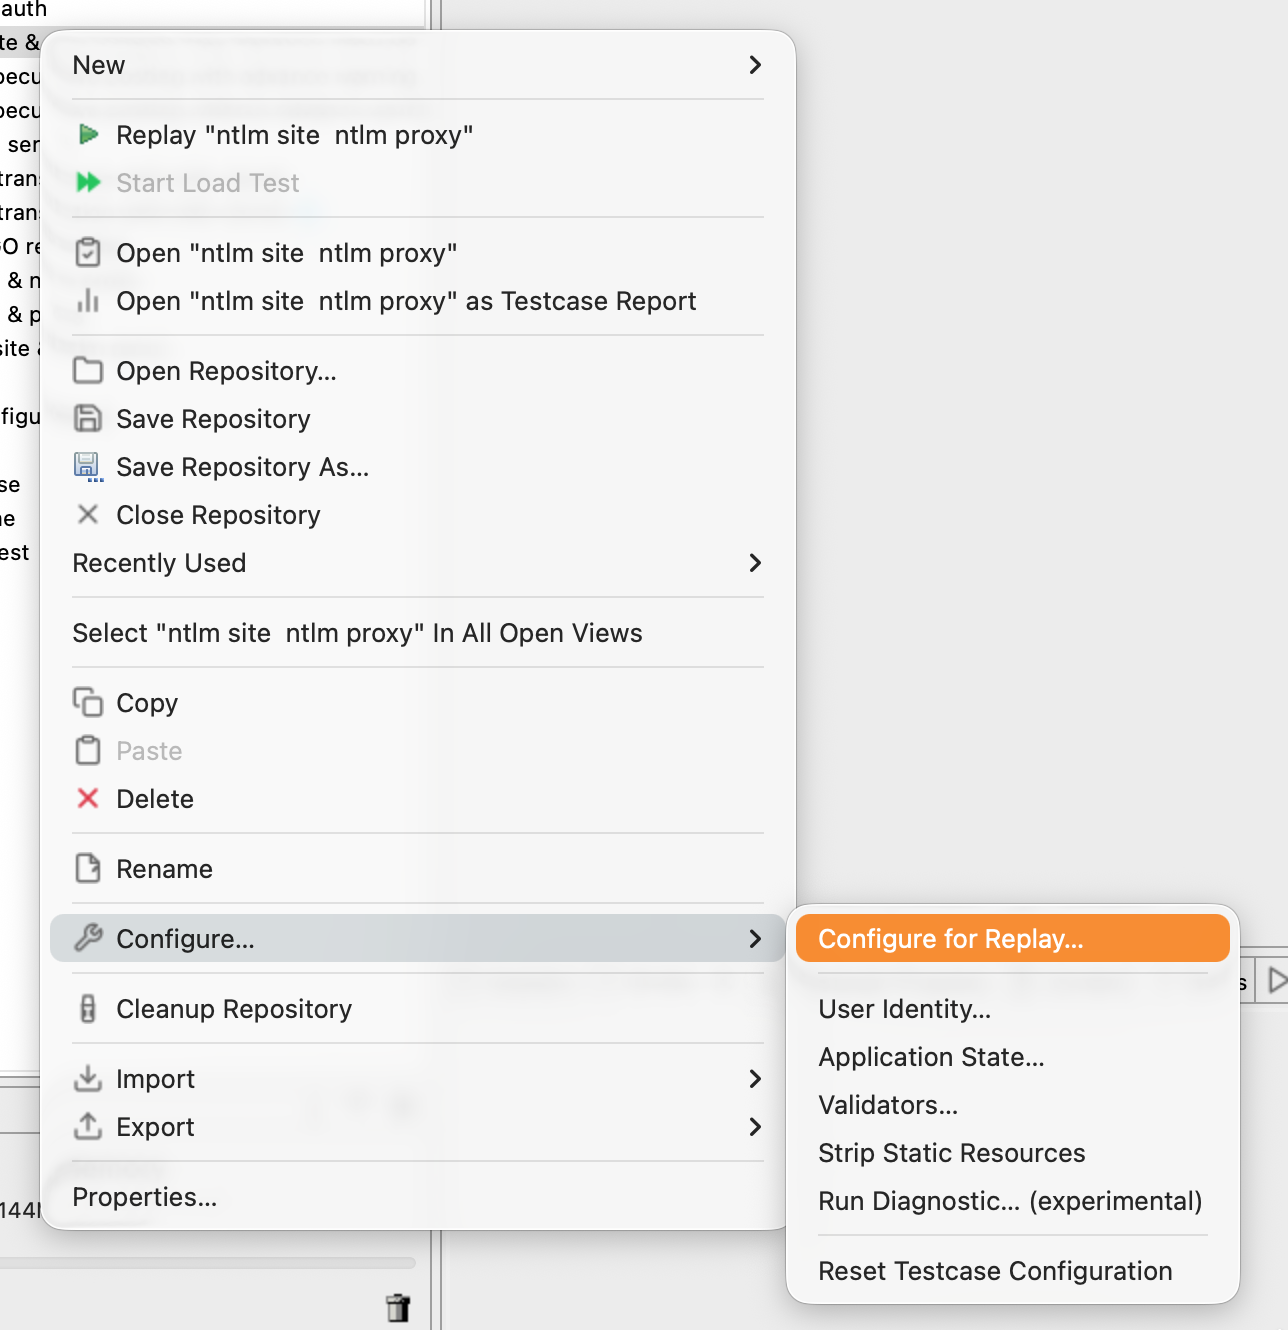
Run the Configure for Replay Wizard
Two pieces of pre-replay configuration matter and Load Tester bundles them into a single wizard: restricting the test case to your own hostnames, then running ASM. Both happen together because the order matters. If ASM runs against third-party traffic you're about to throw away, it wastes time building correlation extractors for transactions you'll never replay.
To open the wizard:
- Right-click the test case in the Navigator
- Configure → Configure for Replay...
Wizard Page 1: Hostname Overview
The wizard opens on Hostname Overview, listing every hostname Load Tester intercepted during recording.
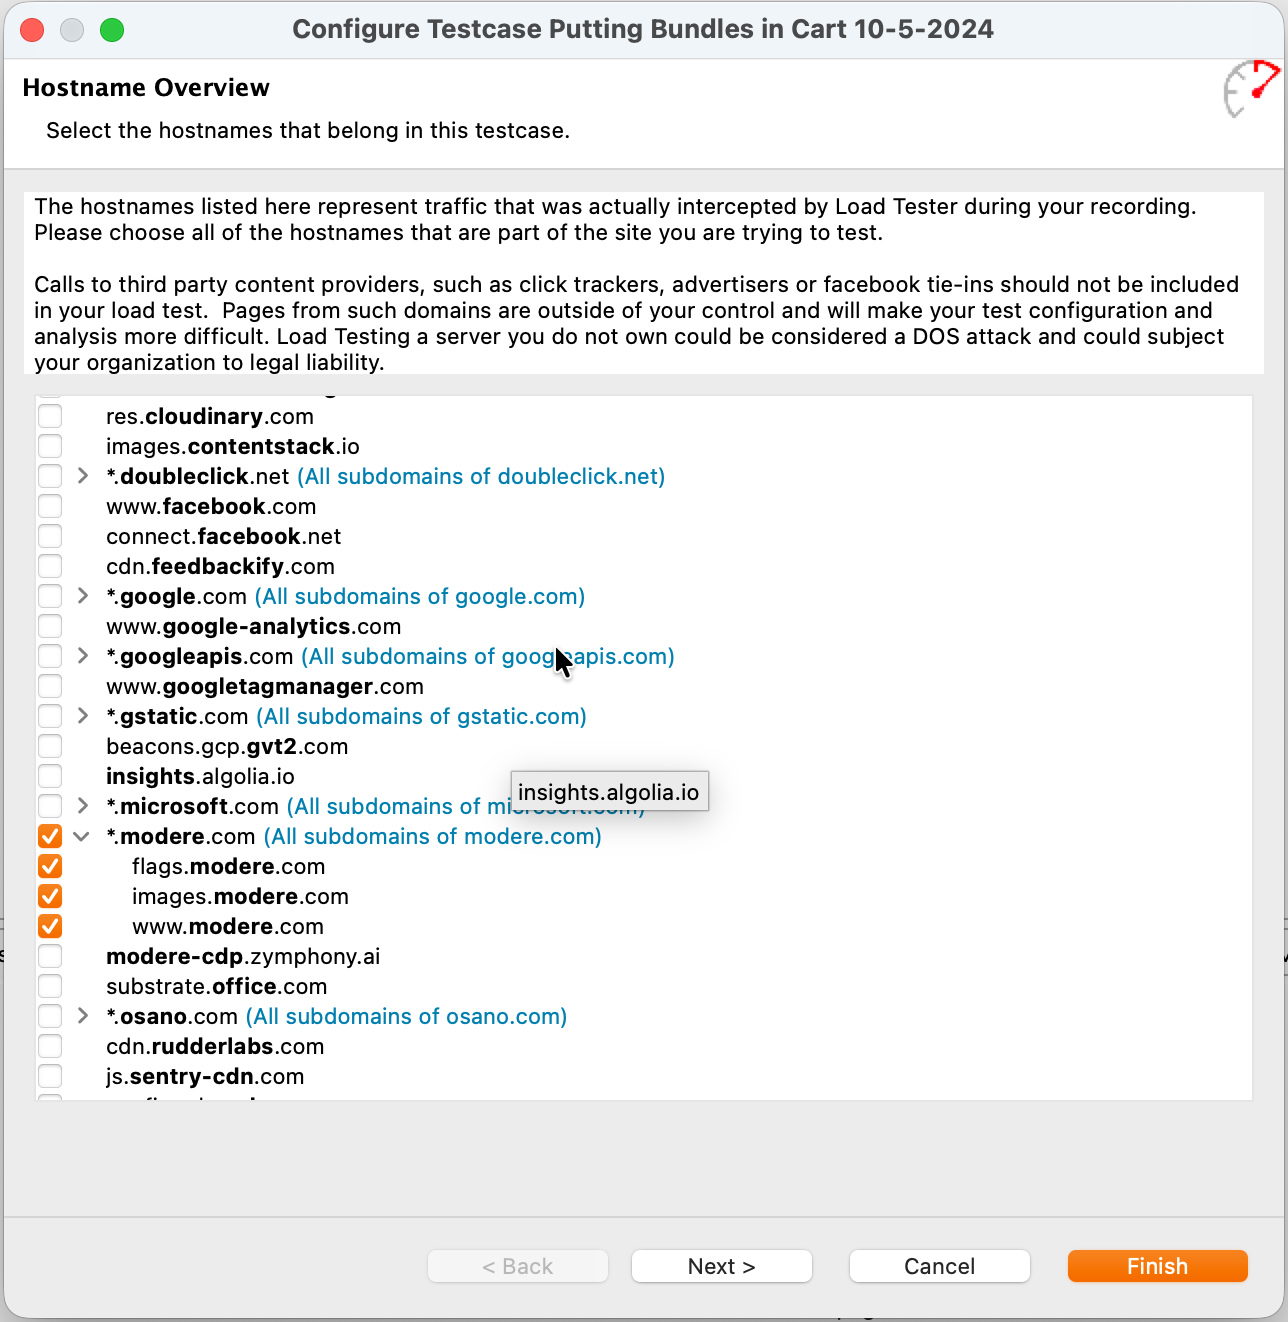
Modern web pages call out to dozens or hundreds of third parties on every load: analytics platforms, advertising networks, tag managers, CDNs, font services, social-media widgets, the works. Your recording captured every one of them. You almost never want them in a load test:
- You don't have permission to load-test them. Hitting Google Analytics, Facebook, DoubleClick, or any other shared service with synthetic traffic at scale can be treated as an attack on infrastructure you don't own. The dialog says this in plain text: "Loading Testing a server you do not own could be considered a DOS attack and could subject your organization to legal liability."
- Their data gets contaminated. If your test fires Google Analytics events, your synthetic traffic shows up in your production analytics dashboard mixed in with real customer behavior. That pollutes business decisions made from that data for weeks afterward.
- Their failures look like your failures. A third-party CDN going slow or rate-limiting your test traffic will make your results look worse than they are, for reasons that have nothing to do with the system you're trying to measure.
- They add configuration overhead. Each third-party hostname is more transactions to inspect, more authentication to correlate, more failure modes to debug. Cutting them out simplifies everything downstream.
The rule: include the minimum set of hostnames needed for the functionality you're testing. Everything else gets dropped.
Check the hostnames that belong to the system you're testing. Leave third parties unchecked: analytics, ad networks, tag managers, social widgets, font CDNs, anything you don't own.
Click Next to continue to ASM. (Clicking Finish here would apply the hostname filter and skip the rest of the wizard, which you'd then have to invoke separately.)
Wizard Page 2: Application State Management (ASM)
ASM is the second page of the wizard. It detects and configures session cookies, CSRF tokens, hidden form fields, OAuth bearer tokens, and other dynamic state that has to change per virtual user. By this point the test case contains only the hostnames you checked, so ASM is doing useful work instead of wrestling with third-party traffic.
Click Finish to apply automatic configuration.
Most test cases work after running ASM with little or no manual tweaking. For details on what ASM does and how to override its decisions, see Application State Management (ASM).
Running ASM Standalone
ASM can also run on its own via Right-click → Configure → Application State... (skipping the hostname-restriction page). Use that path only when hostnames are already correct and you just want to re-run ASM after a change. For first-time configuration, run the full Configure for Replay wizard.
Make Sure Your Application is Running
This sounds obvious, but you would be surprised how often it's the problem:
- For production sites: Verify the site is accessible in your browser
- For test environments: Ensure your development/staging server is running
- For localhost: Start your local server before replaying
Step 1: Start the Replay
Click the Play Button
-
Open your test case in the Test Case Editor (double-click in Navigator). The editor opens with a replay control row at the top.
-
Click the Play button (the green triangle) in the toolbar.
The replay starts immediately.
Replay Modes
The Play button has a dropdown arrow next to it. Clicking the arrow opens a menu of five replay modes:
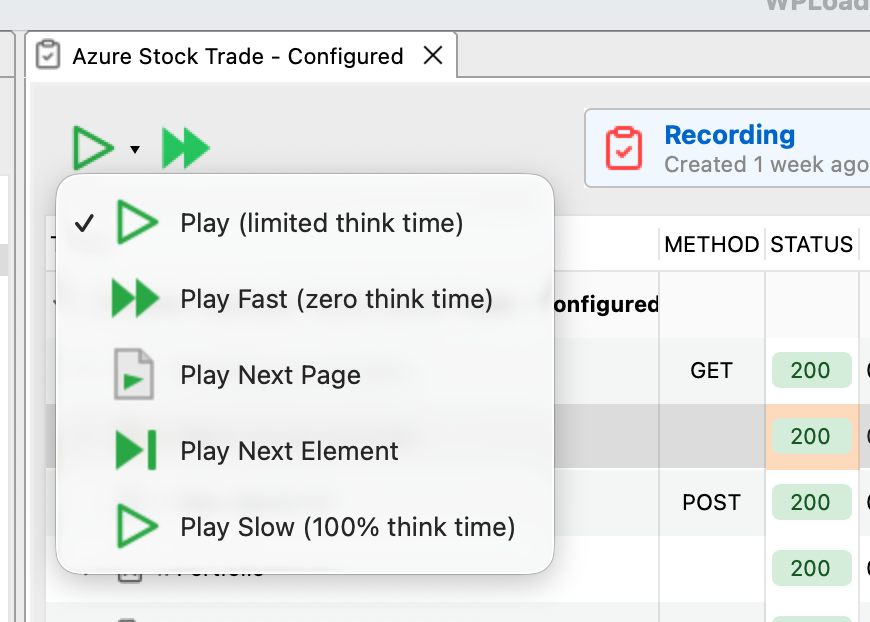
| Mode | What It Does | When to Use |
|---|---|---|
| Play | Limited think time. Replays at a practical pace by capping the recorded think time at a maximum. | Default. Use this for most replays. Faster than real-user pacing but still includes pauses, so the server isn't getting hammered with zero gap between requests. |
| Play Fast | Zero think time. Sends each request as soon as the previous response arrives. | Fastest validation when you just want to know whether the test case works. Not realistic. |
| Play Slow | Full recorded think time (100%). Replays at exactly the pace you browsed during the recording. | When you specifically want to reproduce real-user pacing, or when the server is sensitive to request rate. |
| Play Next Page | Replays one page at a time, then pauses. | Debugging. Use when you want to inspect each page boundary before continuing. |
| Play Next Element | Replays one transaction at a time, then pauses. | Debugging. Use when you need to step through individual HTTP requests inside a page. |
For your first replay, use regular Play. It's the right balance for validation: enough delay between requests to behave like a real session, fast enough to finish quickly. Switch to Play Slow only when you specifically need recorded-pacing fidelity, and to Play Fast only when you don't care about timing and just want a pass/fail result.
Step 2: Monitor the Replay
While the replay runs, several views update in real-time to show progress.
Status View
The Status View (bottom right) shows high-level replay status:
What you see:
- Current page being replayed
- Progress (pages completed / total pages)
- Elapsed time
- Status messages ("Extracting values", "Validating response", etc.)
For more on the Status View and where it sits in the workbench, see UI Navigation → Status View.
Replay View
The Replay View provides detailed information about the current replay:
What it shows:
- Page-by-page progress with response times
- Real-time error notifications
- Extraction status (dynamic values being pulled from responses)
- Validation results (whether responses contain expected content)
- User variables and their provenance in the Variables sub-tab: every variable the virtual user is holding, plus which extractor wrote each value and on which page
For the full reference (Connections, Datasets, and Variables sub-tabs, menu actions, and debugging patterns), see The Replay View.
Content View
The Content View (bottom center) displays the actual page content as it's replayed:
What you see:
- Rendered HTML pages (like viewing in a browser)
- Images, CSS styling
- JSON/XML responses for API calls
This is where you verify the application is returning what you expect, not just something.
For more on the Content View, including how to read JSON/XML responses and switch rendering modes, see UI Navigation → Content View.
Watch for Errors
If replay encounters errors, they appear immediately in the Errors View (bottom). Don't wait for the replay to finish. If you see errors, you can stop and investigate right away. For details on what the Errors View shows, see UI Navigation → Errors View.
Step 3: Review the Results
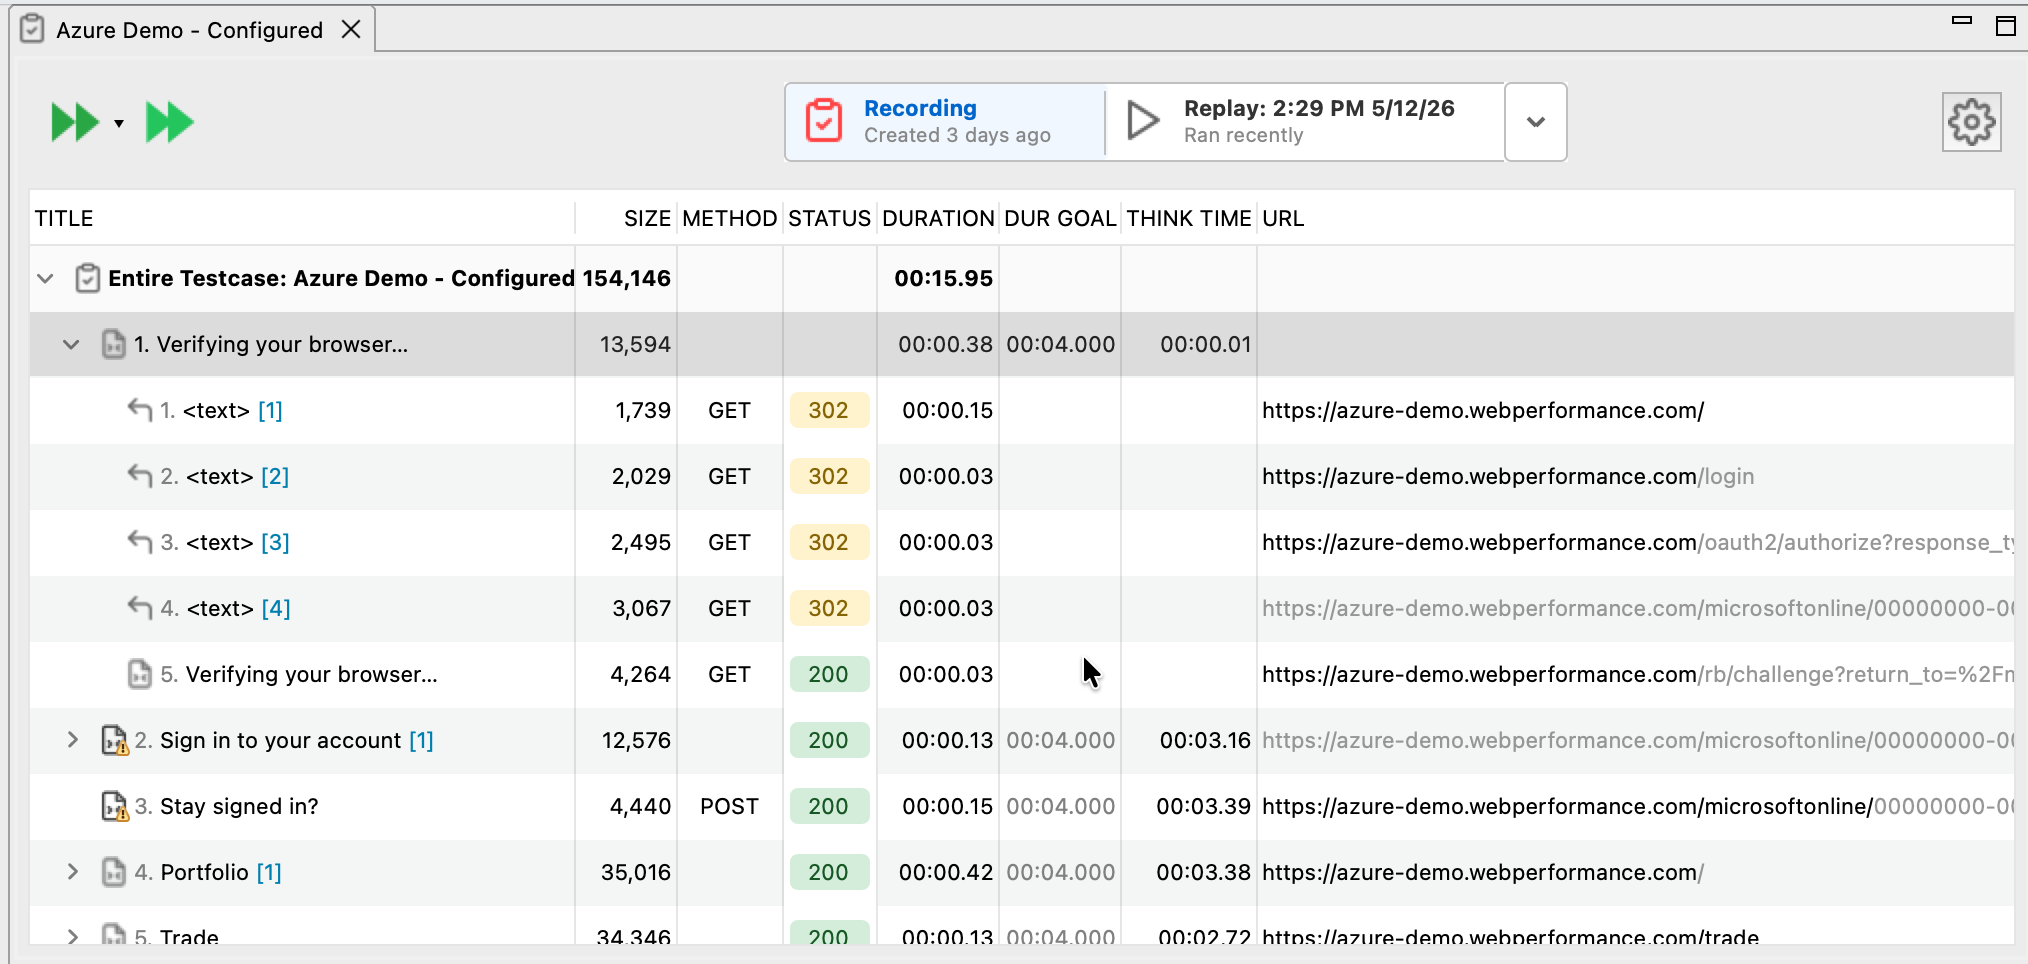
After replay completes, the Test Case Editor updates to show the replayed response time alongside the recorded one for each transaction, along with status codes for each request. Transactions that failed get a red indicator; successful ones get a green indicator.
Response times being different from the recording is normal. They vary with network conditions, server load, cache state, and a dozen other things you don't control during replay. What matters for replay validation is whether the transactions completed without errors, not whether the numbers match.
Success Criteria
A successful replay means:
✅ No HTTP errors (no 401, 403, 404, 500 status codes) ✅ All pages completed (progress reached 100%) ✅ No validation failures (content matches expectations) ✅ Dynamic values extracted (session cookies, tokens, etc.)
Response times don't need to match exactly. They vary based on network conditions, server load, and a dozen other factors. What matters is that the replay completed successfully without errors.
Understanding Different Outcomes
Scenario 1: Perfect Replay (All Green)
What you see: All transactions green, no errors.
What it means: Your test case is ready for load testing. Configuration is correct, dynamic values are being extracted and injected properly.
Next step: Configure a load test and scale to multiple virtual users.
Scenario 2: Authentication Failures (401/403 Errors)
What you see: Errors view shows "401 Unauthorized" or "403 Forbidden" on requests after login.
What it means: Session cookie or authentication token wasn't extracted or injected correctly.
Solution:
- Check if ASM was run (it usually handles this automatically)
- Verify the session cookie appears in the Fields View with a dynamic datasource
- See Debugging Failed Replays for step-by-step troubleshooting
Scenario 3: Validation Failures
What you see: Errors view shows "Validation failed: expected content not found".
What it means: The server returned a response, but it didn't contain expected text or elements.
Common causes:
- Application returned an error page instead of the expected page
- CSRF token validation failed (server rejected the request)
- Session expired or invalid
Solution: Check the Content View to see what the server actually returned, then investigate why it's different from expectations.
Scenario 4: Connection Refused / Timeout
What you see: Errors view shows "Connection refused" or "Connection timeout".
What it means: Load Tester couldn't reach your application server.
Solution:
- Verify your application is running
- Check the hostname/port in the test case matches your running server
- For localhost applications, ensure firewall isn't blocking connections
Replay Controls During Execution
While a replay is running, you can control it:
| Button | Action | When to Use |
|---|---|---|
| Stop | Stop the replay immediately | Cancels the replay if you see errors early |
| Pause | Pause after current transaction completes | Freeze replay to inspect current state |
| Play (while paused) | Resume replay | Continue after pausing |
Tip: Use Pause when debugging to examine the current state in detail before continuing.
Viewing Multiple Replays
Each time you replay a test case, Load Tester saves the results. You can compare multiple replay runs:
-
Click the replay dropdown at the top-left of the Test Case Editor
-
Select a previous replay to view its results
-
Right-click → Edit Replays to rename or delete old replays
Why this matters: Compare baseline performance (first replay) with recent replays to detect performance degradation over time.
Validation Rules
Load Tester automatically validates that transactions return expected HTTP status codes (200 = success). But applications fail in subtler ways than that. A response with status 200 can still be an error page, a logged-out landing page, or a CAPTCHA challenge. If your test treats every 200 as success, those slip through silently.
Validation rules are how you tell Load Tester what a correct response actually looks like. They're configured on the test case (not on the replay), and once defined they run on every replay and every load test. The most useful baseline rule for almost any test case is a Content Contains check on the post-login page asserting that the user is actually authenticated.
For the full guide (the three validation types, useful patterns, what happens when validation fails, and how to write rules that hold up under load), see Validation Rules in the Configuring chapter.
Common Questions
Which replay mode should I use?
Use Play for most replays. It uses limited think time, which makes the replay realistic enough to give the server time to process requests in roughly the right rhythm, but caps long pauses so the replay actually finishes.
Use Play Slow when you need real recorded pacing. The replay reproduces every think-time pause from the recording at 100%, which matters when the server is sensitive to request rate or when you're specifically reproducing a timing-related bug.
Use Play Fast when you just want to verify the test case works and don't care about how long anything takes. Zero think time, fastest possible run.
Use Play Next Page or Play Next Element when you're debugging and want to advance one step at a time.
Why are replay response times different from recording?
Response times vary based on network conditions, server load, database state (empty vs. populated), and cache state (cold vs. warm). This is normal. What matters is that the replay completes successfully, not that times match exactly.
Can I replay while the application is under load?
Yes, but replay times will be slower if the server is busy. For baseline validation, replay when the server is idle. For stress testing, use a load test instead of replay.
How many times should I replay before load testing?
At least once successfully. Many teams replay 2-3 times to verify consistency. If replays occasionally fail at random, investigate before proceeding to load testing.
What if my replay works sometimes but fails other times?
This usually points to race conditions in the application, session timeout issues (the replay takes longer than the server's patience), or non-deterministic server behavior where responses contain some element of randomness.
See Debugging Failed Replays for troubleshooting intermittent failures.
Next Steps
After a successful replay, your test case works. Move on to configuring a load test (virtual user count, ramp-up time, duration), then run it, and finally analyze the results to identify performance bottlenecks.
If replay failed, start with debugging the failure, check the common errors, and review your ASM configuration to verify dynamic values are being extracted.
Related Topics: - Your First Recording - Understanding Replay Results - Debugging Failed Replays - Application State Management (ASM) - Load Test Concepts