Configuring a Load Test
A load test configuration tells Load Tester how many virtual users to simulate, when to add them, and how long to run the test. The difference between "100 users added instantly" and "100 users added gradually over 10 minutes" is dramatic. The first creates a spike that may overwhelm your server unfairly; the second simulates realistic traffic growth.
Why configuration matters: If you configure the test wrong, you get misleading results. Too many users too fast, and you create unrealistic stress patterns that would never happen in production. Too few users for too short a time, and you don't stress the server enough to learn anything useful.
This guide shows you how to:
- Create a new load configuration
- Choose the right load profile (constant, stepped, exponential)
- Configure virtual user ramp rates and test duration
- Run multiple test cases simultaneously
- Simulate network bandwidth limitations
- Optimize configurations for different testing goals
Prerequisites
Before configuring a load test, you need:
- Test case that replays successfully - Always verify replay works before load testing (see Running a Replay)
- Understanding of production traffic patterns - How do real users arrive? Gradually or in spikes?
- Testing goal - Are you finding capacity limits, testing sustained load, or validating performance improvements?
Don't skip replay verification. If your test case fails during replay (401/403 errors, correlation failures), it will fail during load testing too. The only difference is that you'll be paying for cloud engines while you troubleshoot.
Step 1: Create a New Load Configuration
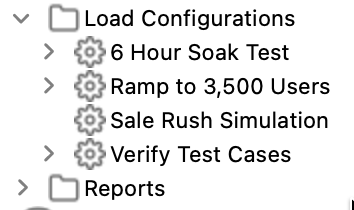
Load configurations are separate from test cases. One test case can have multiple load configurations: a "small smoke test," a "full capacity test," an "overnight soak test." Each defines a different way to stress the same user workflow.
Create the Configuration
- Right-click the test case in Navigator → New → Load Configuration
- Name the configuration:
Capacity Test(or descriptive name for this load profile) - Click OK
Result: Load Configuration Editor opens with default settings (constant load, 10 VUs, 10 minutes).
Step 2: Choose Load Profile Type
The load profile determines how virtual users are added over time. Four patterns are available, each suited for different testing goals.
The Load Configuration Editor surfaces the current profile as a Ramp Pattern summary (for example, "10 → 50 users"). To pick or change a profile, click the Ramp Pattern field. The Ramp Pattern dialog opens with the four Test Plan options as radio buttons, alongside the duration, starting-user count, and ramp-step settings. A live preview chart on the right shows the resulting curve.
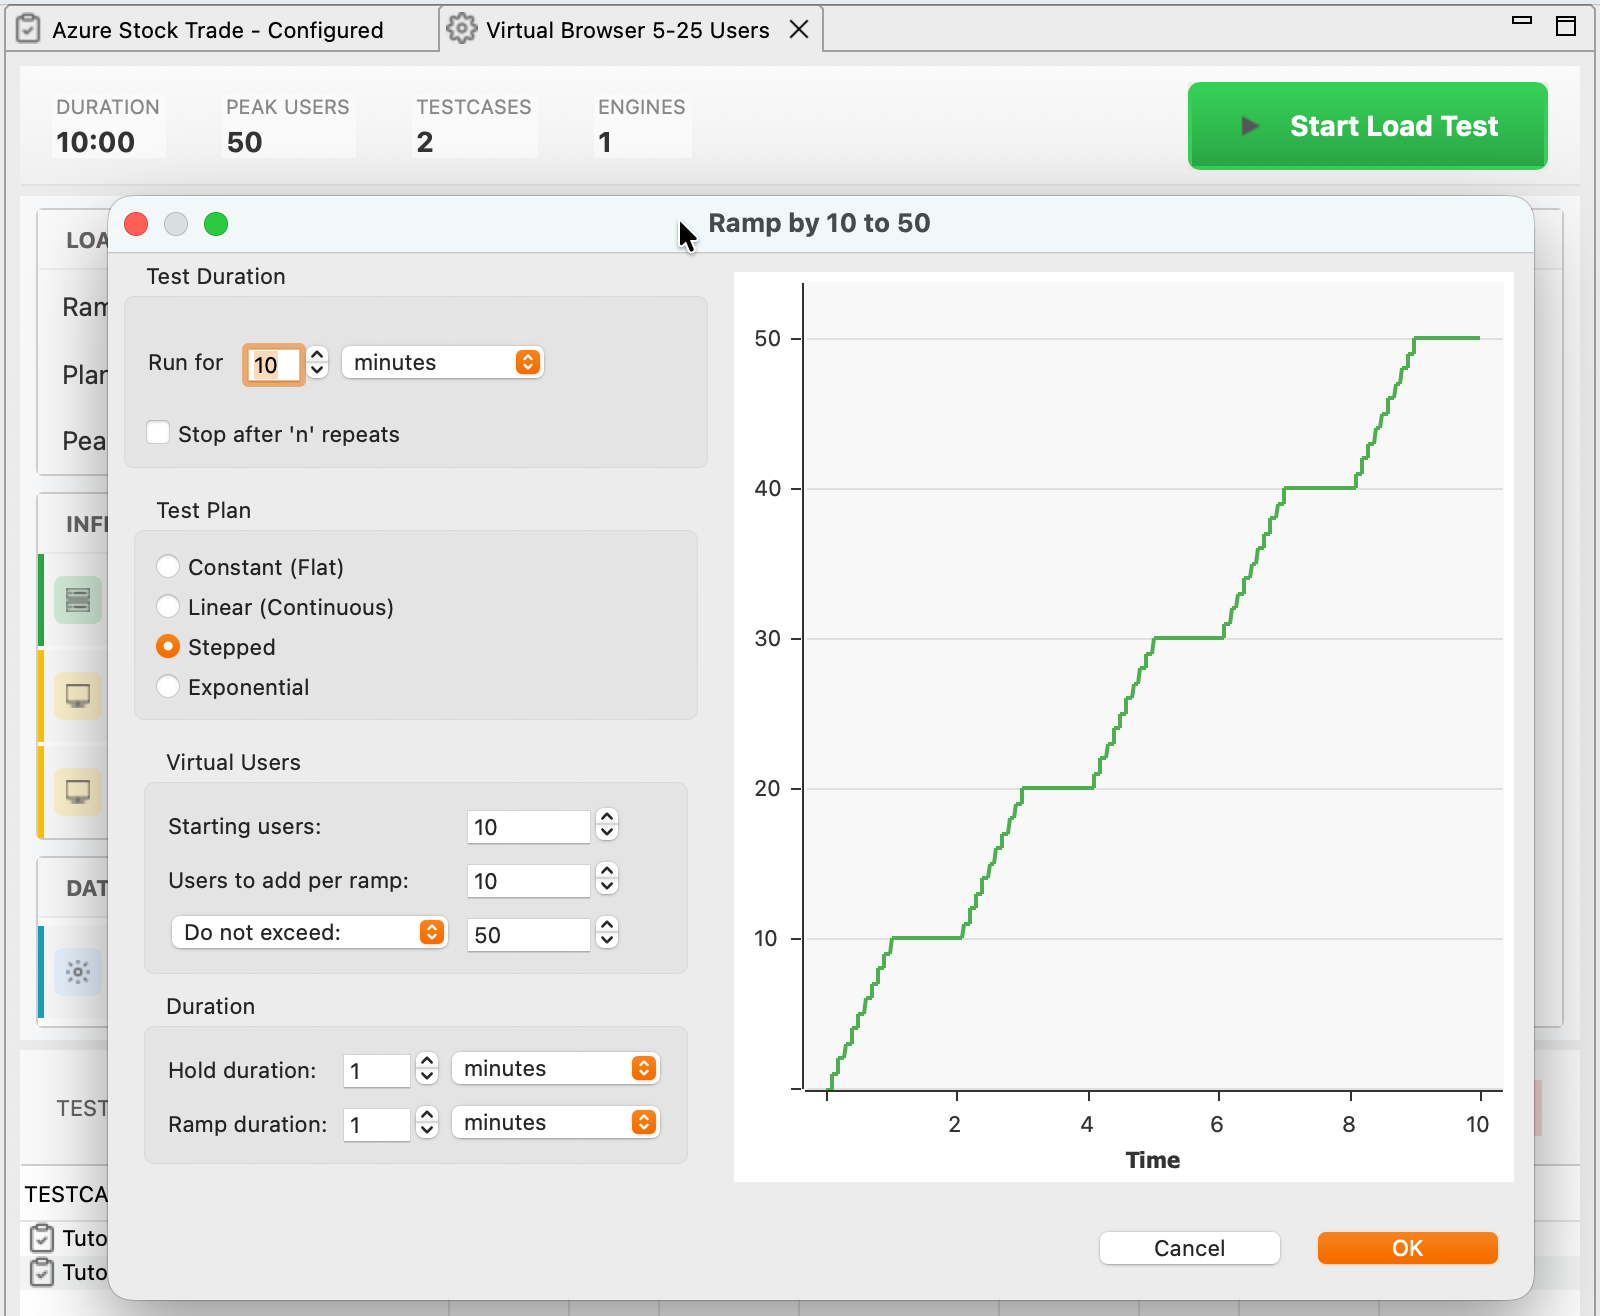
The four Test Plan options:
Constant (Flat)
What it does: Adds all virtual users immediately at the start, maintains constant load throughout the test.
Example:
- VUs: 100
- Duration: 1 hour
- Result: 100 VUs run for entire hour (no ramping)
Graph:
xychart-beta
    title "Constant Load Profile"
    x-axis "Time (minutes)" [0, 15, 30, 45, 60]
    y-axis "Virtual Users" 0 --> 120
    line [100, 100, 100, 100, 100]
When to use: Sustained load testing (prove the system handles 100 users for 12 hours straight), soak testing (identify memory leaks and resource exhaustion over time), and stability testing (verify no crashes or degradation during extended load).
When NOT to use: Finding capacity limits (constant load never increases, so you won't discover the max) or simulating traffic growth (real traffic ramps up gradually, not all at once).
Stepped
What it does: Adds virtual users in discrete steps at regular intervals, holds steady between ramps.
Example:
- Starting VUs: 100
- Ramp increment: 50 VUs
- Ramp interval: 5 minutes
- Duration: 30 minutes
- Result: 100 → 150 → 200 → 250 → 300 → 350 VUs
Graph:
xychart-beta
    title "Stepped Load Profile"
    x-axis "Level (each held for ~5 minutes)" ["100 VUs", "150 VUs", "200 VUs", "250 VUs", "300 VUs", "350 VUs"]
    y-axis "Virtual Users" 0 --> 400
    bar [100, 150, 200, 250, 300, 350]
When to use: Finding capacity limits by incrementally increasing load until performance degrades. Baseline performance testing where you compare behavior at 100, 200, 300 VUs to identify thresholds. Measuring modest changes, for instance if last month's test supported 1,000 VUs, test 500-1,500 VUs in steps to detect regressions.
Configuration (in the Ramp Pattern dialog):
- Test Plan: Stepped
- Starting users:
100(begin with known-good load) - Users to add per ramp:
50(increment size per ramp) - Do not exceed:
350(cap on total virtual users) - Hold duration:
5minutes (steady-state at each level) - Ramp duration:
1minute (time to add each batch) - Run for:
30minutes (total test length, set in Test Duration)
Best practices: Start conservatively (if you don't know server capacity, begin with 10-50 VUs). Use small increments, 10-20% increase per ramp rather than doubling. Allow 3-5 minutes between ramps to give the server time to stabilize. You need steady-state data at each level, not a blur.
Exponential
What it does: Adds a percentage of current virtual users at each ramp (multiplicative growth).
Example:
- Starting VUs: 100
- Increase by: 25% per ramp
- Ramp interval: 5 minutes
- Duration: 30 minutes
- Result: 100 → 125 → 156 → 195 → 244 → 305 VUs
Graph:
xychart-beta
    title "Exponential Load Profile (25% growth per ramp)"
    x-axis "Level (each held for ~5 minutes)" ["100 VUs", "125 VUs", "156 VUs", "195 VUs", "244 VUs", "305 VUs"]
    y-axis "Virtual Users" 0 --> 350
    bar [100, 125, 156, 195, 244, 305]
When to use: Testing unfamiliar systems where you don't know if the server handles 100 or 10,000 VUs (start at 100, increase 25% each ramp). Rapid capacity discovery, because exponential growth reaches high loads much faster than stepped. Testing scalability patterns to see whether performance degrades linearly or exponentially with load.
Configuration (in the Ramp Pattern dialog):
- Test Plan: Exponential
- Starting users:
100 - Users to add per ramp:
25% (when Exponential is selected, this field accepts a percentage) - Do not exceed:
2000(cap to prevent runaway growth) - Hold duration:
5minutes (steady-state at each level) - Ramp duration:
1minute (time to add each batch) - Run for:
30minutes (total test length, set in Test Duration)
Why exponential is powerful: If server capacity is 5,000 VUs, a stepped profile adding 50 VUs every 5 minutes takes 245 minutes to reach it. An exponential profile with 25% growth reaches it in about 40 minutes.
Caution: Exponential growth can overwhelm servers quickly; always set a max user limit.
Linear (Continuous)
What it does: Adds virtual users at a constant rate continuously throughout the test (no steady-state holds).
Example:
- Starting VUs: 0
- Add: 10 VUs per minute
- Duration: 30 minutes
- Result: 0 → 10 → 20 → 30 → ... → 300 VUs (smooth ramp)
Graph:
xychart-beta
    title "Linear (Continuous) Load Profile"
    x-axis "Time (minutes)" [0, 5, 10, 15, 20, 25, 30]
    y-axis "Virtual Users" 0 --> 350
    line [0, 50, 100, 150, 200, 250, 300]
When to use: Rarely. No steady-state periods means you can't observe sustained performance at any specific load level. The one exception is stress-to-failure testing, where the explicit goal is to continuously increase load until something breaks.
Why stepped is usually better: Stepped profiles give you clean data at 100 VUs (steady for 5 minutes), then 150 VUs (steady for 5 minutes), and so on. Linear profiles continuously change the load, making it nearly impossible to establish baselines.
Step 3: Configure Test Duration
Test duration depends on your testing goal:
| Goal | Recommended Duration | Why |
|---|---|---|
| Quick validation | 5-10 minutes | Verify config changes work without waiting hours |
| Baseline performance | 30-60 minutes | Gather statistically significant data across multiple load levels |
| Capacity testing | 30-90 minutes | Ramp through full capacity range |
| Soak testing | 8-24 hours | Identify memory leaks, resource exhaustion over time |
| Stress to failure | Until failure | Find absolute breaking point (may be hours) |
Configuring duration:
- In Load Configuration Editor, find Duration field
- Enter value:
60minutes (or desired length) - Or: Select "Stop after 'n' repeats" (test runs until each test case completes N times, regardless of time)
Sample period: How often metrics are collected (default: 15 seconds)
- Short tests (< 1 hour): 10-15 seconds
- Medium tests (1-4 hours): 30-60 seconds
- Long tests (> 4 hours): 5 minutes
Why sample period matters: An 8-hour test with 10-second samples produces 2,880 data points per metric, which can exhaust memory. Five-minute samples for the same test produce 96 data points. Much more manageable.
Step 4: Configure Virtual User Distribution
If using multiple test cases, configure how virtual users are distributed across them.
Adding Multiple Test Cases
- In Load Configuration Editor, find Test Cases section
- Select test case from dropdown
- Click "+" to add it to the list
- Repeat for additional test cases
Example:
- Test case 1:
Browse Products(weight: 70) - Test case 2:
Purchase Flow(weight: 30)
Result: 70% of virtual users run "Browse Products", 30% run "Purchase Flow".
Understanding Weights
Weights are relative; they don't have to add up to 100:
| Test Case | Weight | Actual Distribution |
|---|---|---|
| Browse | 70 | 70/(70+30) = 70% |
| Purchase | 30 | 30/(70+30) = 30% |
Or:
| Test Case | Weight | Actual Distribution |
|---|---|---|
| Browse | 7 | 7/(7+3) = 70% |
| Purchase | 3 | 3/(7+3) = 30% |
Both are equivalent. Load Tester calculates percentages automatically.
Matching production traffic: Check your server logs for the actual ratio of browsing to purchasing. If logs show 80% browsing, 15% cart, 5% checkout, configure weights 80/15/5 and your load test will generate production-like traffic distribution.
Step 5: Configure Network Simulation
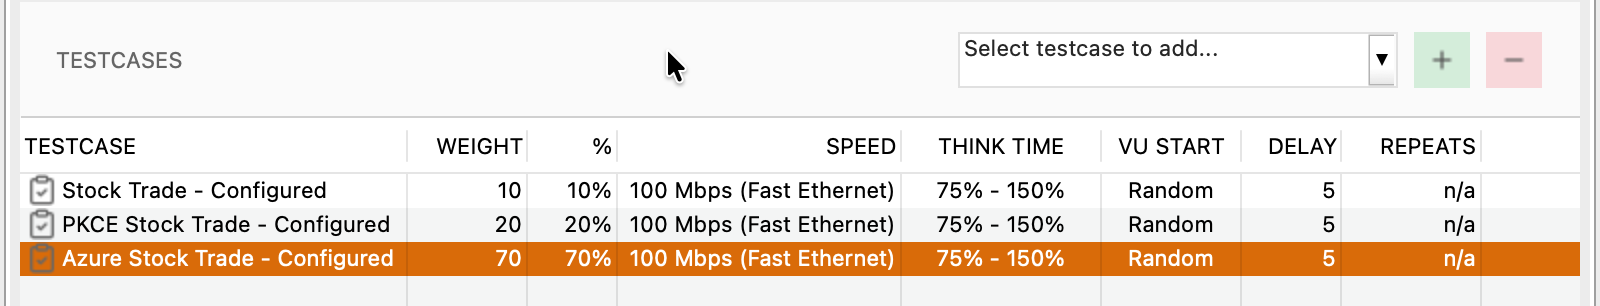
Network bandwidth simulation limits how fast each virtual user can download content. This simulates users on different connection types (cable modem, mobile, slow DSL). Bandwidth is set per test case in the Speed column of the TESTCASES section, where a dropdown offers preset connection types (Fast Ethernet, broadband, 4G, 3G, slow DSL, dial-up).
Bandwidth Options
Common presets:
| Bandwidth | Connection Type | Typical Use |
|---|---|---|
| Unlimited | LAN/Datacenter | Testing server capacity without network constraints |
| 10 Mbps | Fast broadband | Typical US/EU home connection |
| 1 Mbps | Slow broadband / 4G mobile | Mobile users, rural broadband |
| 128 Kbps | Slow DSL / 3G mobile | Low-bandwidth scenarios |
| 56 Kbps | Dialup modem | Legacy testing (rare) |
| Custom | Any value | Specific bandwidth constraint |
Configuring bandwidth:
- In Load Configuration Editor, find Network Simulation section
- Select bandwidth:
10 Mbps(or desired speed) - Applies per virtual user: Each VU limited to this bandwidth
Why simulate network speed: Real users don't have gigabit connections, so simulating 10 Mbps reveals resources that load too slowly over realistic bandwidth. It also lets you test bandwidth capacity: if 100 VUs at 10 Mbps each demand 1 Gbps total, does your server's network handle that? For mobile testing, simulate 1 Mbps and watch which pages become unusable.
When to use "Unlimited":
- ✅ Server capacity testing: Bandwidth shouldn't be the bottleneck; you're testing server CPU/database, not network
- ✅ Internal apps: Users on corporate LAN have fast connections
- ❌ Public websites: Real users have limited bandwidth; unlimited isn't realistic
Step 6: Configure Think Time
Think time is the pause between pages as users read content, fill forms, make decisions.
Default behavior: Think time is recorded during test case recording (e.g., if you paused 5 seconds between clicking links, that's recorded).
Configuring think time override:
- Right-click test case in Navigator → Properties
- Think Time tab
- Select override option:
- Use recorded think time (default) - Replay pauses match recording pauses
- Scale think time - Multiply recorded pauses by percentage (e.g., 50% = half the pauses)
- Fixed think time - Override all pauses with fixed value (e.g., 2 seconds between all pages)
- No think time - Remove all pauses (equivalent to Play Fast in a single-user replay)
When to override: Scale to 50% if you want tests to run in half the time. Remove think time entirely if you want all VUs constantly requesting pages (unrealistic, but useful for stress testing). Use a fixed 5-second think time if you want to remove the variability captured during recording.
Configuration Examples
Example 1: Find Server Capacity (Stepped Profile)
Goal: Determine how many virtual users the server can handle before performance degrades.
Configuration:
| Setting | Value | Why |
|---|---|---|
| Load Profile | Stepped | Incrementally increase load to find limit |
| Starting users | 50 | Known-good baseline (server handled this before) |
| Add users | 50 | 10% increments (assuming target ~500 VUs) |
| Every | 5 minutes | Enough time for steady-state measurements |
| Duration | 60 minutes | Ramps to 650 VUs over 60 min |
| Bandwidth | Unlimited | Don't let network limit server testing |
| Think time | Recorded | Realistic user behavior |
Expected result: Response times stay flat until around 400-500 VUs, then start climbing. That inflection point is the capacity limit.
Example 2: Sustained Load Test (Constant Profile)
Goal: Prove system can handle 200 VUs for 8 hours straight without failures or memory leaks.
Configuration:
| Setting | Value | Why |
|---|---|---|
| Load Profile | Constant | Steady load for entire test |
| Virtual users | 200 | Production peak load |
| Duration | 8 hours | Overnight soak test |
| Sample period | 5 minutes | Reduce memory usage for long test |
| Bandwidth | 10 Mbps | Realistic user bandwidth |
| Think time | Recorded | Realistic behavior |
Expected result: Response times stay flat for 8 hours, no errors, no memory exhaustion.
Example 3: Unfamiliar System (Exponential Profile)
Goal: Test a new server where you don't know if it handles 100 VUs or 10,000 VUs.
Configuration:
| Setting | Value | Why |
|---|---|---|
| Load Profile | Exponential | Rapidly discover capacity range |
| Starting users | 100 | Safe starting point |
| Increase by | 25% | Exponential growth |
| Every | 3 minutes | Fast ramps to discover capacity quickly |
| Max users | 5000 | Upper safety limit |
| Duration | 40 minutes | Reaches 5000 VUs if server holds |
| Bandwidth | Unlimited | Testing server, not network |
Expected result: Performance degrades somewhere between 100 and 5,000 VUs. Now you know the neighborhood. The next test uses a stepped profile to find the exact address.
Example 4: Mobile Users (Network Simulation)
Goal: Test mobile user experience with realistic bandwidth constraints.
Configuration:
| Setting | Value | Why |
|---|---|---|
| Load Profile | Stepped | Baseline measurements at different loads |
| Starting users | 10 | Low mobile concurrency |
| Add users | 10 | Small increments |
| Every | 5 minutes | Steady-state measurements |
| Duration | 30 minutes | 6 load levels (10, 20, 30, 40, 50, 60 VUs) |
| Bandwidth | 1 Mbps | 4G mobile connection |
| Think time | Recorded | Realistic |
Expected result: You identify which pages and resources are too large for mobile bandwidth, where "too large" means download times exceeding 3 seconds.
Advanced Configuration
Configuring Load Engines
By default, Load Tester uses the built-in load engine (runs on your workstation). For larger tests, add cloud or remote engines.
- In Load Configuration Editor, find Load Engines section
- Click "Edit..."
- Add cloud engines or remote engines
- Virtual users distribute automatically across all engines
See: Cloud Load Testing for cloud engine configuration.
Configuring Datasets Per Virtual User
If your test case uses datasets (different usernames per VU), configure dataset behavior:
- Right-click test case → Properties → Datasets tab
- Select dataset lifespan:
- Per virtual user (default) - Each VU gets a different dataset row
- Per iteration - VU gets new row on each test case iteration
- Shared - All VUs share the same row
See: Datasets & Data-Driven Testing for complete dataset configuration.
Scheduled Load Tests
To run load tests automatically at specific times (e.g., nightly regression tests):
- Click Replay button dropdown (▶️ with down-arrow)
- Select: Advanced Replay...
- Select: Schedule for...
- Set date/time
- Click OK
Load test runs unattended at the scheduled time (useful for overnight tests).
Troubleshooting Load Configurations
Problem: Test Finishes Immediately (No VUs Started)
Symptom: Load test starts and immediately finishes. Engines View shows 0 VUs.
Causes:
- No engines available: Built-in engine is disabled or overloaded
- Engine capacity exhausted: Requesting 5000 VUs but engine supports max 3000
- Test Case issues: Test case fails immediately on startup
Diagnostic steps:
- Open Engines View: Window → Show View → Engines
- Check if engine appears: Should show "Local Engine" or cloud engines
- Check engine capacity: Right-click engine → Properties → See "User Capacity"
- If engine capacity < requested VUs: Add more engines or reduce VU count
Fixes:
- No engines: Start the local load engine (Tools → Preferences → Load Tester → Start local engine)
- Capacity exceeded: Reduce VU count or add cloud engines
- Test Case fails: Verify test case replays successfully before load testing
Problem: Load Test Runs But Metrics Are All Zero
Symptom: Load test appears to run (VUs shown in Engines View), but response times, hits/sec, and bandwidth are all zero.
Cause: Sample period too long for test duration. If sample period is 5 minutes but test duration is 2 minutes, no samples are collected.
Fix:
- Shorten sample period: Load Configuration Editor → Sample Period → Set to 15 seconds
- Or lengthen test duration: Run test for at least 3× the sample period
Problem: Peak VUs Lower Than Expected
Symptom: Configured for 1000 VUs but test only reaches 800 VUs.
Causes:
- Engine self-regulation: Engine detected overload (CPU > 90%) and stopped adding VUs
- Memory exhaustion: Engine ran out of memory
- Test duration too short: Not enough time to ramp to peak
Diagnostic steps:
- Check Engines View: Look for warnings (CPU overload, memory warnings)
- Check test duration: Did test end before reaching peak VUs?
- Calculate ramp time: Stepped profile (50 VUs every 5 min) takes 100 minutes to reach 1000 VUs
Fixes:
- Add more engines: Distribute VUs across more engines to avoid overload
- Increase test duration: Ensure enough time to complete all ramps
- Reduce ramp rate: Add VUs more slowly (every 10 min instead of 5 min)
Ask the AI to Optimize Load Configurations
If you're unsure how to configure your load test:
I need to test a web application with 500 virtual users to find the capacity
limit. Should I use stepped or exponential profile, and what ramp rates make sense?
The AI can:
- Recommend load profile type based on your testing goal
- Calculate appropriate ramp rates and durations
- Suggest starting VU counts based on server characteristics
- Optimize sample periods for test duration
- Configure network simulation based on target user demographics
- Explain why specific configurations work better for your scenario
- Troubleshoot "test finishes immediately" or "VUs not starting" issues
Next Steps
After configuring a load test:
- Run the load test: See Running a Load Test
- Monitor during test: See Monitoring During a Load Test
- Analyze results: See Analyzing Results
For advanced configuration:
- Cloud engines: Cloud Load Testing
- Datasets: Datasets & Data-Driven Testing
- Server monitoring: Server Monitoring