Inspecting a Recording
After stopping a recording, inspect what was captured. A quick review of the recorded pages, transactions, and HTTP headers verifies the recording is complete and ready for configuration.
Five minutes here saves hours of debugging later.
Why Inspect Your Recording?
Before configuring or replaying a test case, verify:
- ✅ All pages were captured: nothing missing from your recorded scenario
- ✅ Transactions completed successfully: no 404s, 500s, or other errors
- ✅ Dynamic content was received: API responses contain expected data
- ✅ Page grouping makes sense: logical organization of pages and resources
Catching recording issues before ASM runs makes configuration much smoother.
The Test Case Editor: Your Recording Overview
When a recording completes, Load Tester opens the Test Case Editor with a tree view of everything captured.
Understanding the Tree Structure
Pages (top level): - Represented by folder icons with page names - Contain all HTTP transactions that make up that page - Named automatically based on the main HTML response
Transactions (nested under pages): - Individual HTTP requests/responses - Include HTML, images, CSS, JavaScript, API calls - Expand a page to see all its transactions
Example tree structure:
📁 Home Page
  └─ GET https://example.com/ (HTML)
  └─ GET https://example.com/logo.png (Image)
  └─ GET https://example.com/style.css (CSS)
  └─ GET https://example.com/app.js (JavaScript)
📁 Login
  └─ POST https://example.com/api/login (JSON)
  └─ GET https://example.com/dashboard (HTML)
📁 Dashboard
  └─ GET https://example.com/api/user (JSON)
  └─ GET https://example.com/api/notifications (JSON)
Collapse/Expand All
Right-click in the tree and select Collapse All or Expand All to quickly navigate large recordings.
Inspecting Page Content
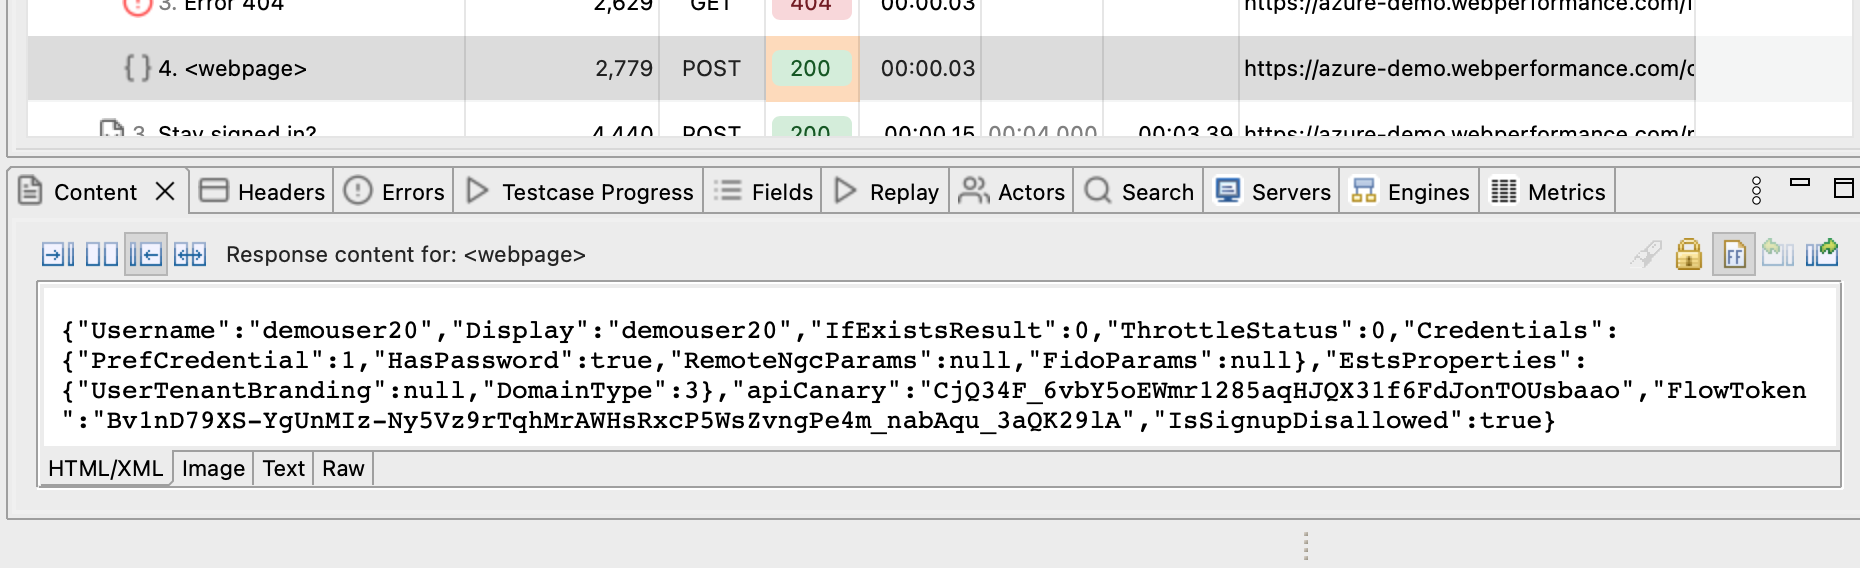
Click any page or transaction in the tree to see its details in the Content View (bottom pane).
Content View Shows What the Browser Saw
For HTML pages: - Rendered page appears in an embedded browser - See exactly what the browser displayed during recording - Interactive preview (can't modify, but can inspect elements)
For JSON/XML API responses: - Formatted, syntax-highlighted text - Easy to scan for session tokens, user IDs, dynamic data - Copy/paste values for manual field configuration
For images: - Image preview - File type and size information
For other resources (CSS, JavaScript): - Syntax-highlighted source code - Raw content for debugging
What to Look For in Content
✅ Check for dynamic data: - Session tokens, CSRF tokens, user IDs - Timestamps, transaction IDs - Any values that change between requests
✅ Verify API responses are complete: - JSON responses aren't truncated - Expected fields are present - No error messages in response bodies
❌ Red flags: - Binary/encoded content where readable text is expected (shouldn't happen in v7.0) - Error messages in HTML pages ("404 Not Found", "500 Internal Server Error") - Empty responses or missing data
Inspecting HTTP Headers
Click a transaction and switch to the Headers View to see the raw HTTP headers.
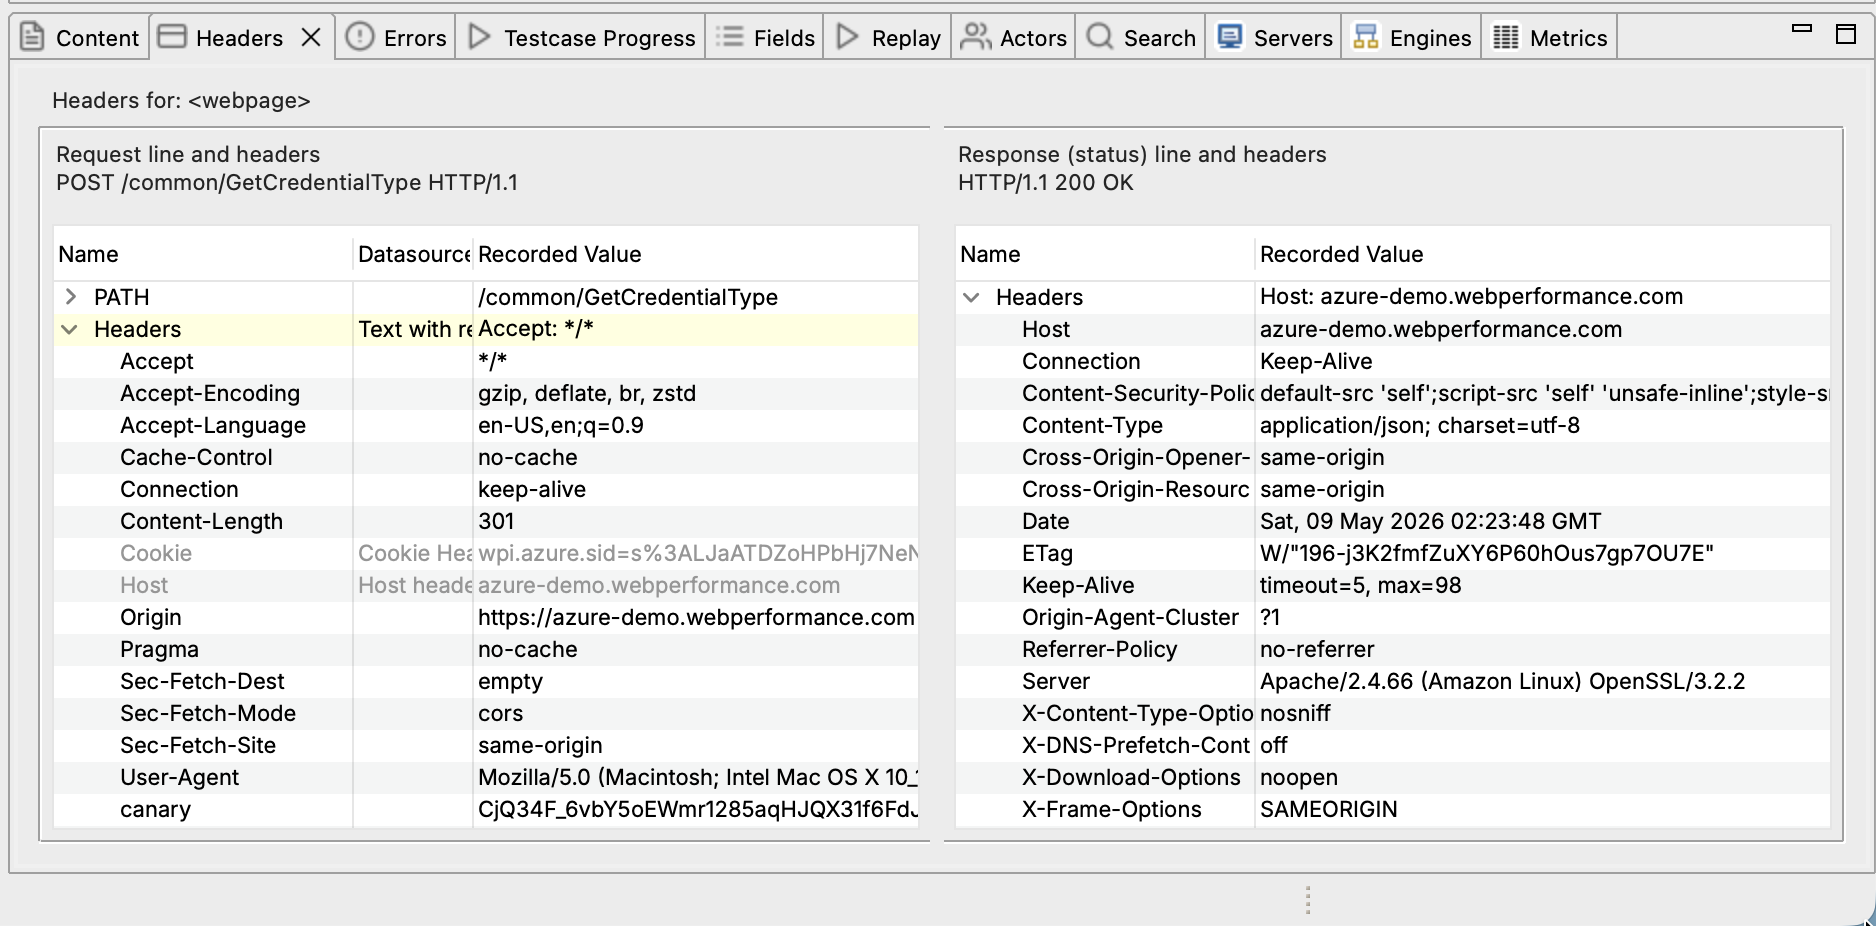
Request Headers (What Browser Sent)
Common headers to notice: - Host: Target server hostname - User-Agent: Browser identification - Cookie: Session cookies sent with request - Referer: Previous page URL - Authorization: Bearer tokens or auth credentials
Response Headers (What Server Returned)
Common headers to notice:
- Status Code: 200 OK, 302 Found, 404 Not Found, etc.
- Set-Cookie: New cookies assigned by server
- Content-Type: text/html, application/json, image/png, etc.
- Content-Encoding: gzip, deflate, br (Brotli)
- Cache-Control: Caching directives
Status Codes to Watch
✅ Success codes (expected): - 200 OK: Request succeeded - 201 Created: Resource created (POST requests) - 302 Found / 303 See Other: Redirect (normal for login flows) - 304 Not Modified: Cached resource still valid
❌ Error codes (investigate): - 400 Bad Request: Malformed request - 401 Unauthorized: Authentication failed - 403 Forbidden: Permission denied - 404 Not Found: Resource doesn't exist - 500 Internal Server Error: Server crashed or had error - 503 Service Unavailable: Server overloaded
Errors During Recording
Some errors during recording are normal (e.g., tracking pixels that 404). But if critical pages or API calls fail, you'll need to re-record. Check the Errors View (below) for details.
Checking for Recording Errors
The Errors View lists problems encountered during recording. Not all errors are fatal.
Common Recording Errors (Usually Harmless)
404 Not Found: - Often tracking pixels, analytics, or CDN resources - If it's a static resource (image, CSS, JS), usually safe to ignore - If it's an API call or main page HTML, investigate why it failed
Timeout errors: - Resource took too long to load - Network latency or slow server - May indicate performance issue worth investigating
SSL/TLS errors: - Shouldn't happen in v7.0 (Chrome extension handles SSL) - If you see SSL errors, report to support
Critical Errors (Must Fix)
❌ Main page HTML failed: - Page returned 404, 500, or other error - Recording is incomplete, must re-record
❌ API call critical to workflow failed: - Login API returned error - Data retrieval failed - Workflow cannot proceed without this data
❌ Browser crashed or became unresponsive: - Partial recording captured - Must re-record
Ask the AI
Inspecting Dynamic Fields (After ASM)
If you've already run ASM, the Fields View shows what dynamic values were detected.
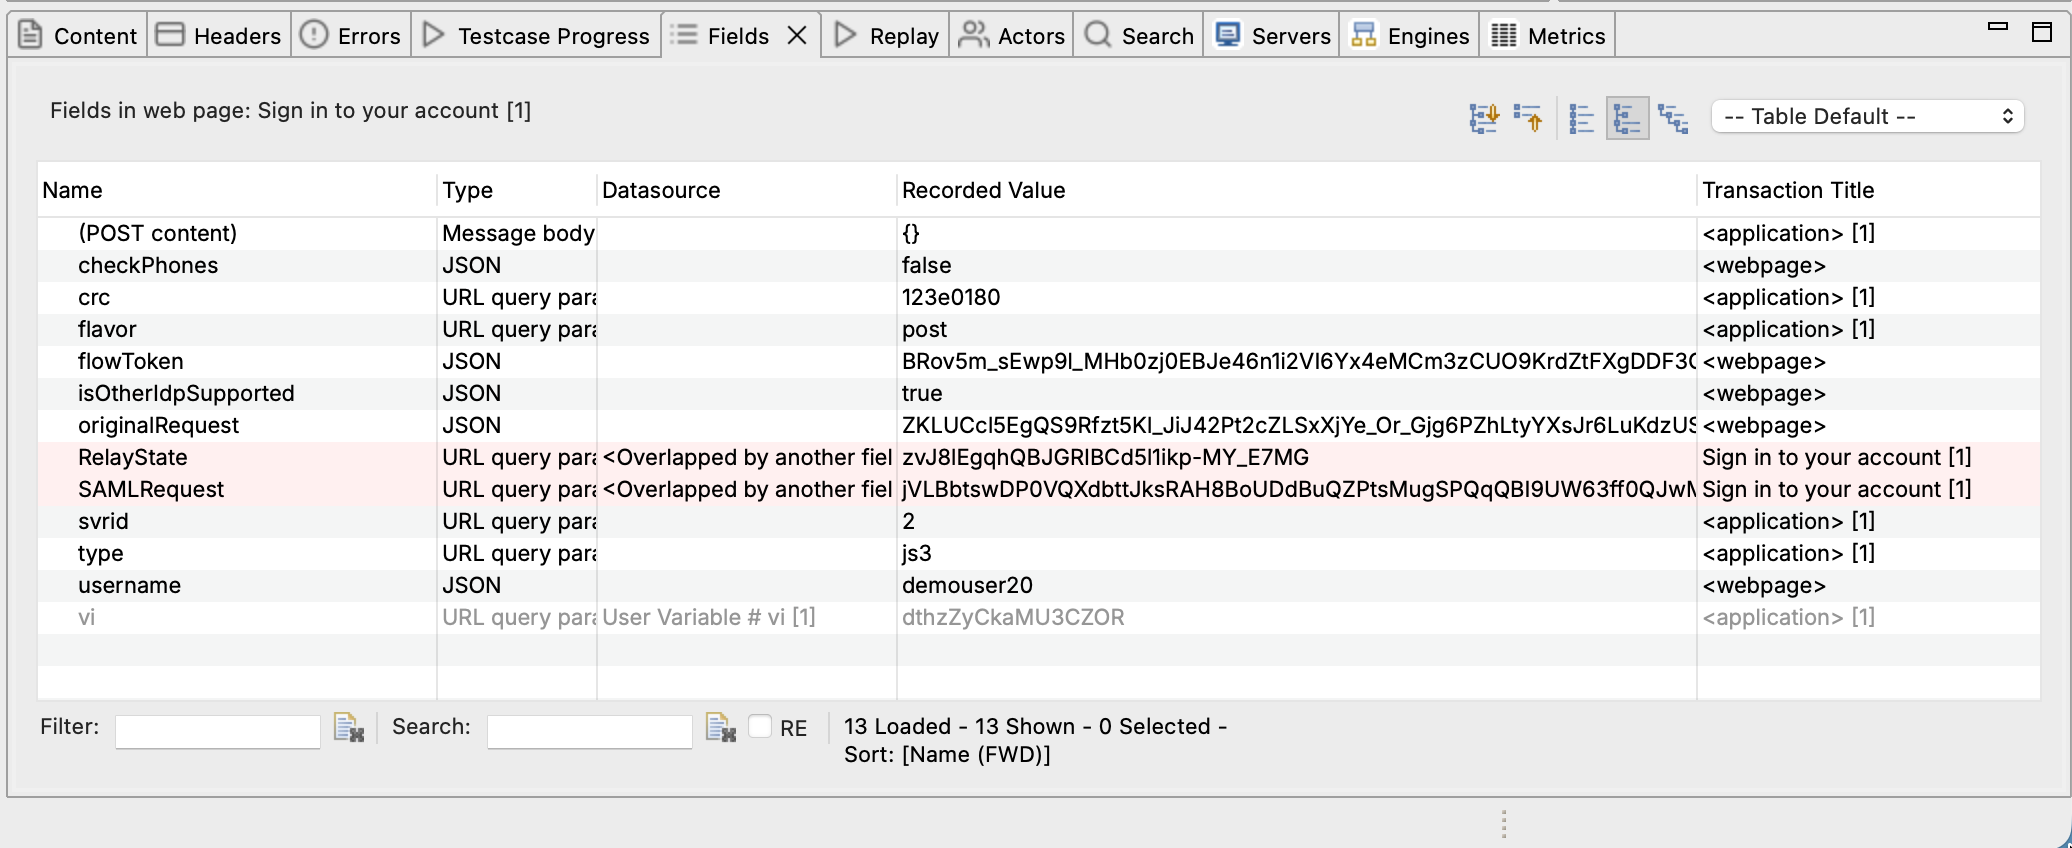
Fields View Shows Correlation Points
What you'll see:
- Field name: Variable name ASM assigned (e.g., sessionId, csrfToken)
- Value: Actual value extracted from response
- Where used: Which transactions reference this field
Common dynamic fields: - Session cookies - CSRF tokens - OAuth Bearer tokens - User IDs - Transaction IDs
If the Fields View is empty, either ASM hasn't run yet or it detected no dynamic fields. The latter is unusual; most sites have at least session cookies.
What Makes a "Good" Recording?
Before moving to configuration and replay, verify your recording has these characteristics:
✅ Complete Workflow Captured
- All pages you navigated appear in the tree
- No missing steps in your scenario
- Logical page grouping (e.g., login POST grouped with redirect)
✅ Clean HTTP Status Codes
- 200 OK for main pages and API calls
- Redirects (302/303) are expected for login flows
- No 404s on critical resources
- No 500 server errors
✅ Dynamic Content Present
- API responses contain data (not empty)
- Session cookies set by authentication flow
- OAuth tokens or Bearer tokens appear in Authorization headers
- User-specific data shows up in responses
✅ Page Grouping Makes Sense
- Resources belong to correct pages (images grouped with the page that referenced them)
- AJAX calls grouped with triggering page (if using Activity Monitoring)
- Login flow grouped logically (POST + redirect + landing page)
Common Recording Issues
Problem: Pages Missing from Recording
Symptoms: You navigated to a page during recording, but it doesn't appear in the Test Case Editor.
Possible causes:
- Page loaded from browser cache (not requested from server)
- Recording stopped before page finished loading
- Chrome extension wasn't capturing traffic (extension disabled, or the page lived under a chrome:// URL the extension can't see)
Solution:
1. Verify the Chrome extension is enabled at chrome://extensions
2. Clear browser cache before recording
3. Wait for pages to fully load before navigating
4. Verify the recording status bar shows "Recording" during the entire session
Problem: Transactions Show 404 Errors
Symptoms: Important transactions have 404 Not Found status codes.
Possible causes: - URL actually doesn't exist (broken link on site) - Session expired during recording (took too long between steps) - Server configuration issue
Solution: 1. Check if URL works in normal browsing (outside recording) 2. Record faster; don't pause for long periods during recording 3. If URL legitimately returns 404, exclude it from test case after recording
Problem: API Responses Are Empty
Symptoms: API calls return 200 OK but response body is empty or contains error message.
Possible causes: - Authentication failed (no session cookie or invalid token) - API requires specific headers you didn't send - Server detected automated recording and blocked it
Solution: 1. Check if session cookie was set by login 2. Verify authentication flow completed successfully 3. Check response body for error messages explaining why data wasn't returned
Problem: Page Grouping Is Illogical
Symptoms: AJAX calls appear as separate pages instead of grouped with the page that triggered them.
Possible causes: - Using Referrer Analysis (default) with AJAX-heavy SPA - Activity threshold too short (AJAX calls timeout)
Solution: 1. Try Activity Monitoring page grouping algorithm 2. Adjust activity threshold (Preferences → Recording) 3. See Recording Settings - Page Grouping
Grouping Help
Next Steps After Inspecting
If recording looks good (complete, clean status codes, dynamic content present):
- Run the Configure for Replay wizard to restrict the test case to your own hostnames and automatically configure dynamic fields
- Run a replay to verify test case works
- Configure datasets if you need multiple users
If recording has issues (missing pages, errors, incomplete):
- Fix the issue (clear cache, check site access, etc.)
- Re-record: don't try to salvage a bad recording
- Inspect again to verify the new recording is clean
Quick Inspection Checklist
Before moving on from a fresh recording, verify:
- [ ] All pages I navigated appear in tree
- [ ] No critical 404 or 500 errors in Errors View
- [ ] API responses contain expected data (check Content View)
- [ ] Session cookies were set (check Headers View for Set-Cookie)
- [ ] OAuth/Bearer tokens appear if site uses OAuth
- [ ] Page grouping is logical (resources grouped with correct pages)
- [ ] No SSL/TLS errors (shouldn't occur in v7.0)
If all boxes checked: ✅ Ready for ASM and configuration
If any issues: ❌ Fix and re-record before proceeding
Next Steps
- Run ASM - Automatically configure dynamic fields
- Run a replay - Verify test case works
- Configure authentication - If ASM didn't handle auth automatically
- Recording troubleshooting - Fix recording issues
Related Topics: