Navigating the UI
Load Tester's interface is built on Eclipse RCP 4.19: a customizable workspace for recording, configuring, and analyzing load tests. Knowing where things live will save you time.
The Main Window
When you launch Load Tester, the main window is organized into six areas:
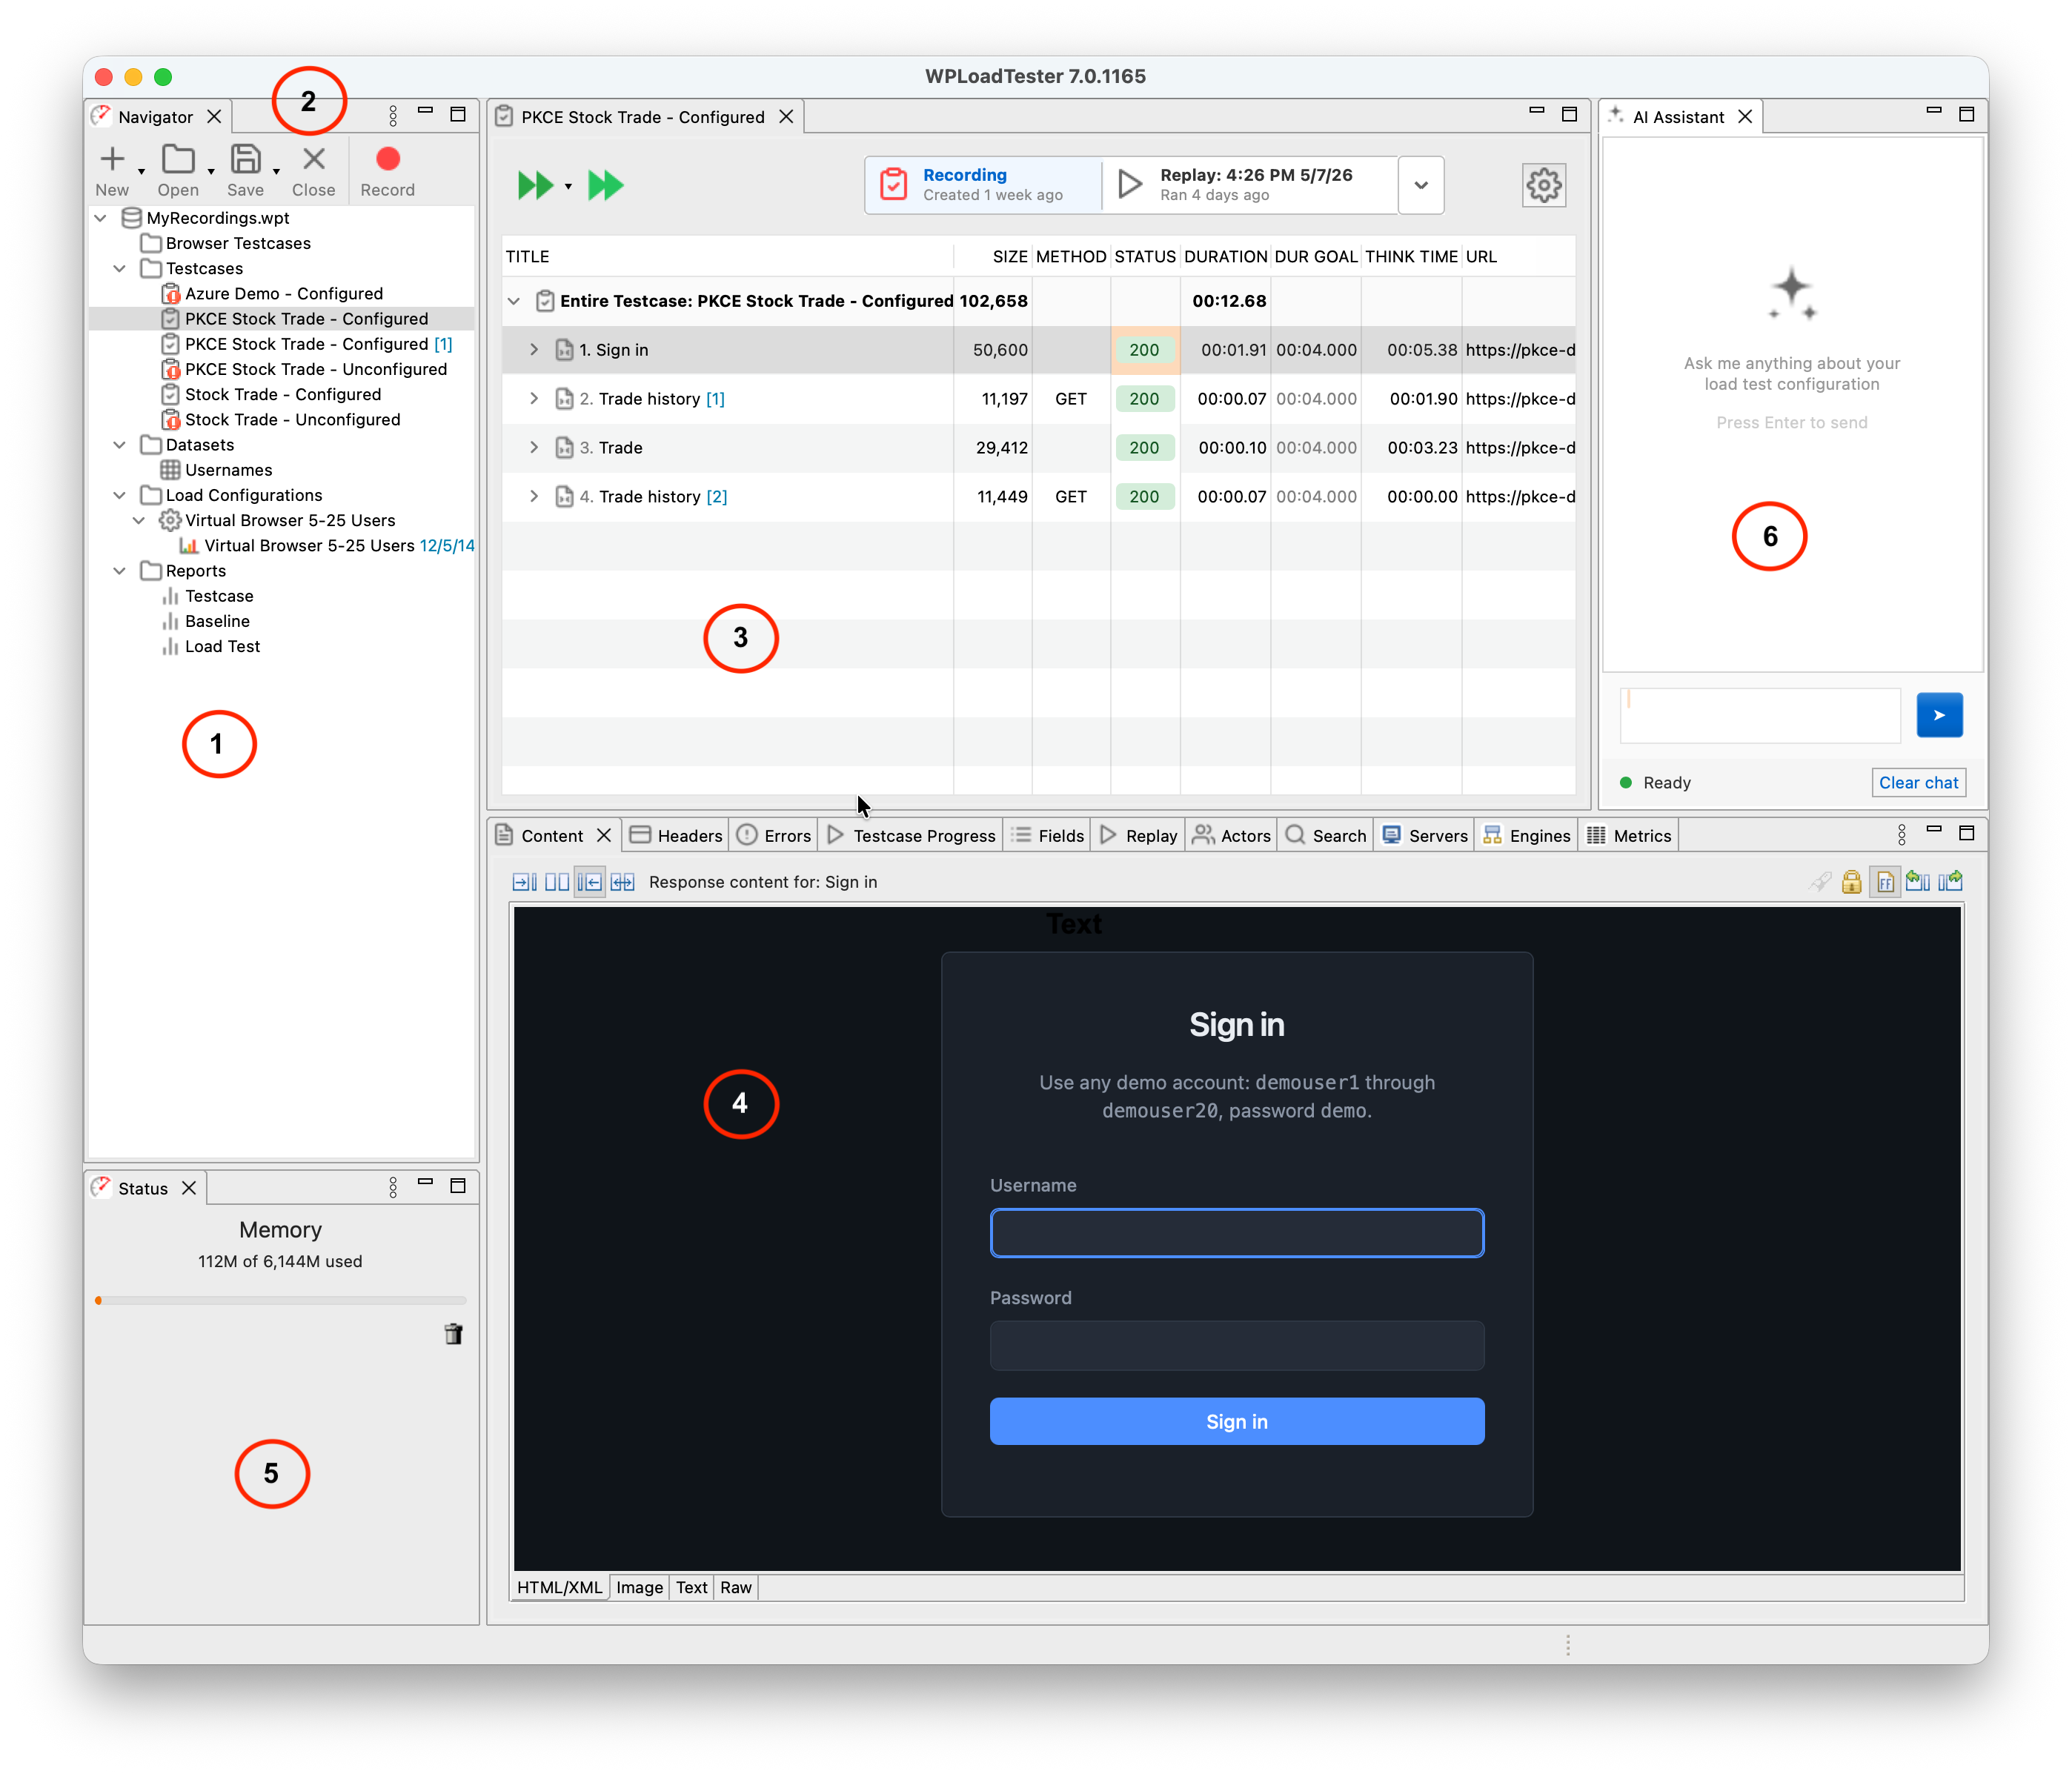
- Navigator (top-left) - Your test case library and repository browser
- Toolbars (top of the editor area) - Quick access to common operations (Record, Replay, Stop, Settings)
- Editor Area (center) - Where you work with test cases and results
- Views (bottom-center) - Detailed inspection and configuration panels (Content, Headers, Errors, Fields, Replay, Actors, Servers, Engines, Metrics, etc.)
- Status View (bottom-left) - Memory usage and real-time operation progress
- AI Assistant (right) - Conversational helper for configuring and debugging your test cases
Each area supports a different phase of the workflow. The Navigator holds your test cases, the Editor lets you inspect and modify them, the Views show the details you need for whatever you're working on, and the AI Assistant is there when you want a second pair of eyes.
Navigator
The Navigator shows your open repositories: test cases, datasets, and load configurations.
What it does: - Displays test cases, datasets, load configurations, and results - Organizes content by repository (project folder) - Provides quick access to recording, replay, and load test operations
How to use it: - Double-click a test case to open it in the Editor - Right-click for context menu (Record, Replay, Run Load Test, etc.) - Drag and drop to reorganize test cases within repositories
The Navigator is your starting point for every operation. Select a test case here to edit it, replay it, or run a load test.
Repository Management
Close repositories you're not actively using (right-click → Close Repository). Load Tester loads all test cases from open repositories into memory, so keeping old projects open costs RAM for no reason.
Toolbars
The toolbar along the top provides one-click access to the most common operations: Record, Play, Stop, Load Test, and Report. They exist so you don't have to dig through menus for things you do constantly.
Editor Area (Center)
The center area is where you work with test cases, view results, and analyze performance. Multiple editors can be open at once in tabs.
Test Case Editor
The Test Case Editor displays your recorded test case as a tree of pages and HTTP requests:
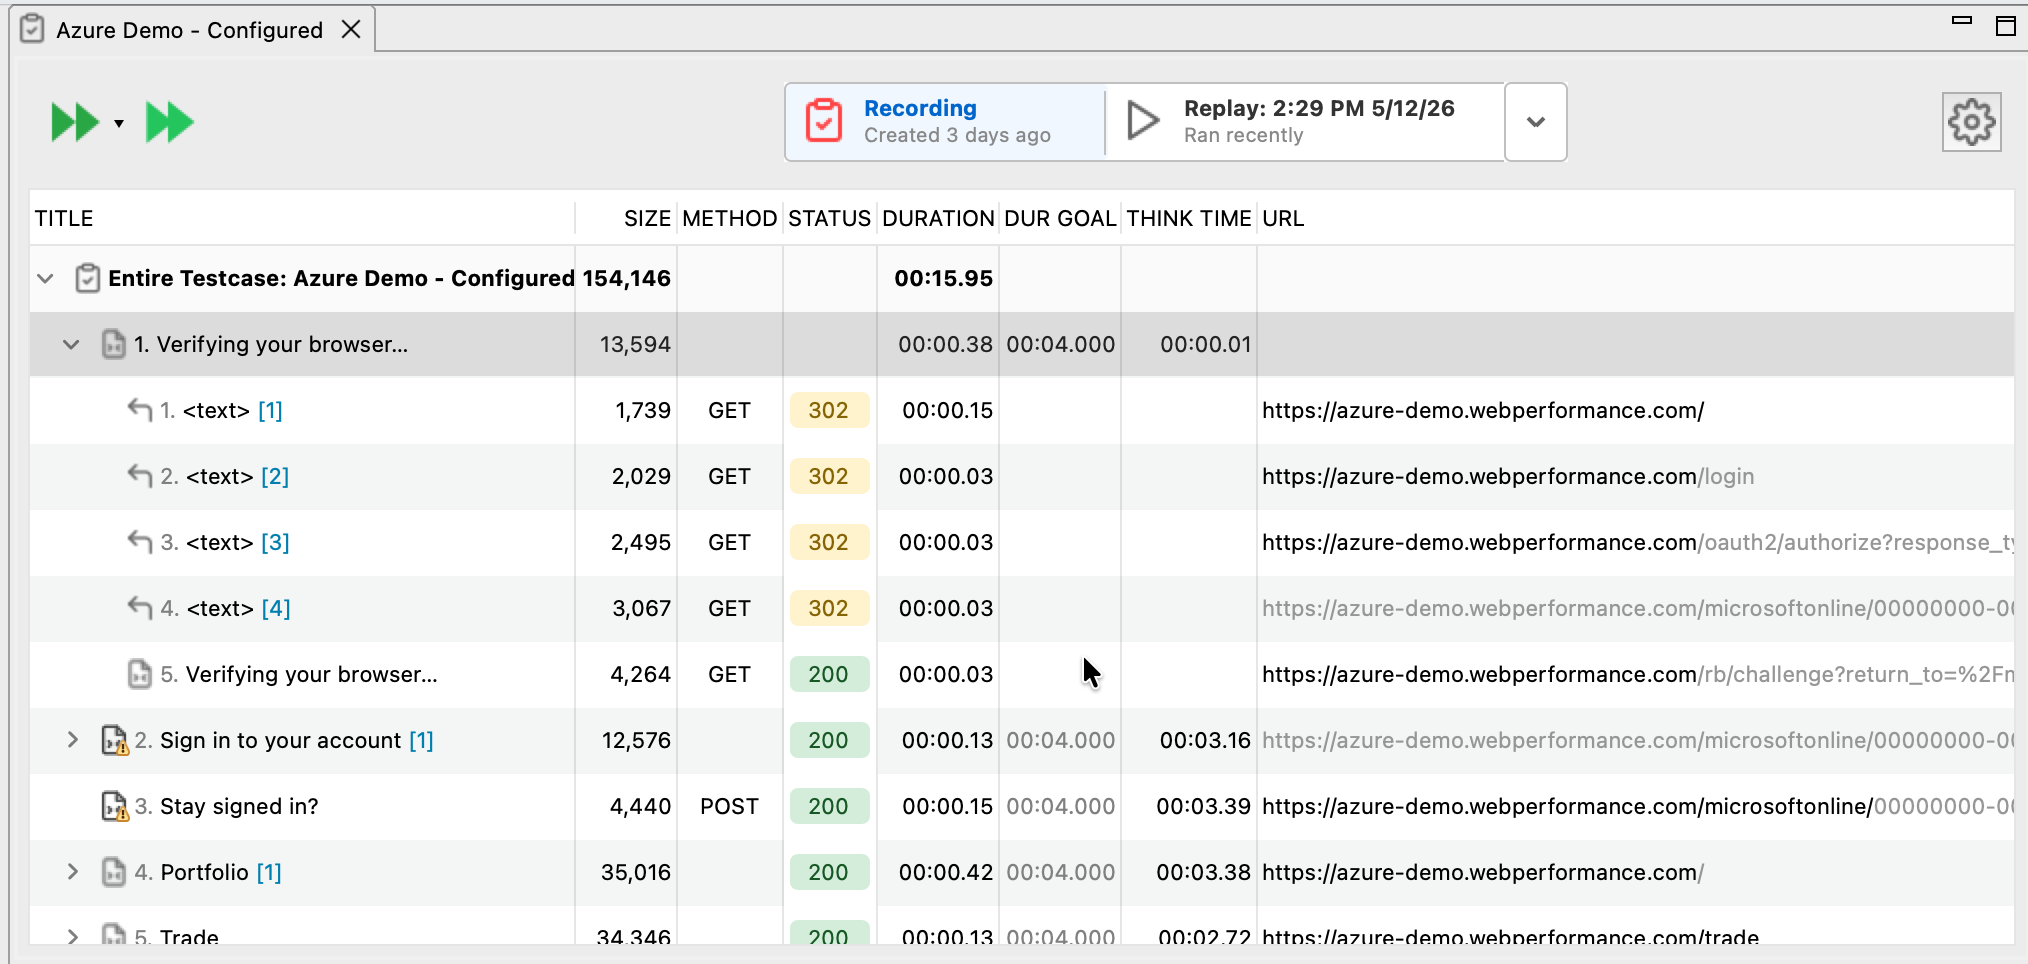
What you see: - Pages (top level) - Logical grouping of related HTTP requests - Transactions (nested) - Individual HTTP requests (HTML, images, CSS, JavaScript, AJAX calls) - Response codes - HTTP status (200 = success, 404 = not found, etc.) - Response times - How long each request took during recording - Response sizes - Bytes transferred for each request
How to use it: - Click column headers to sort by response time, size, or URL - Click a page or transaction to see details in the Views below - Icons indicate resource types: HTML pages, images, stylesheets, scripts, and a padlock icon for SSL/HTTPS
This is where you inspect your recorded test case, spot slow pages, and understand the application's behavior before you configure for load testing.
Dataset Editor
When you double-click a dataset in the Navigator, the Dataset Editor opens:
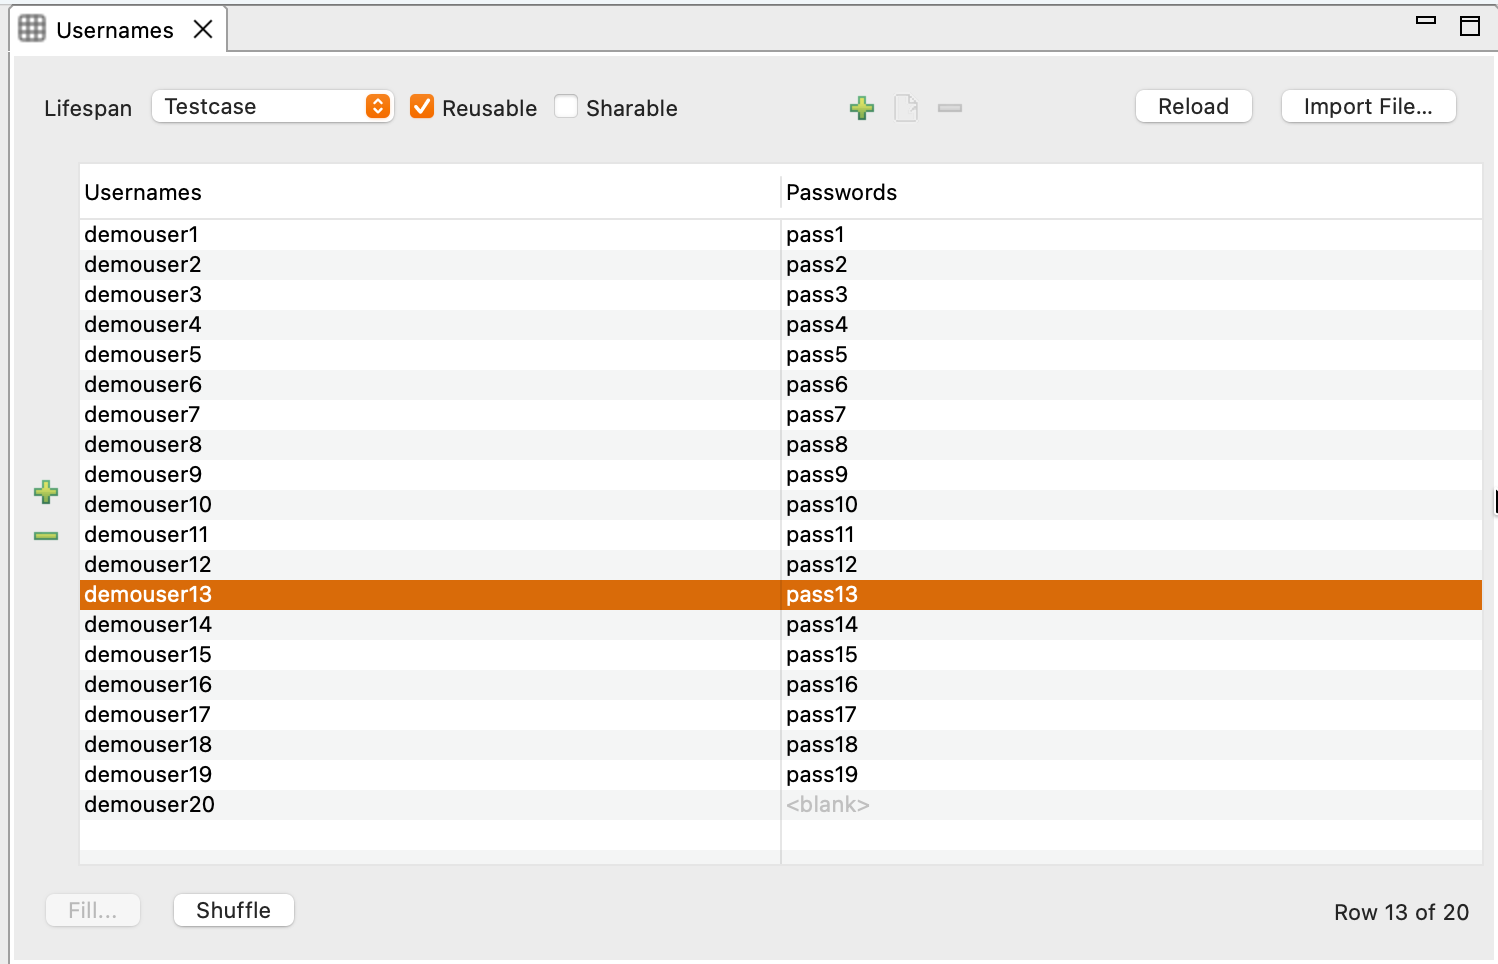
What it does: - Displays data rows and columns (like a spreadsheet) - Allows editing cells to customize test data - Shows dataset settings (delimiter, quote character, etc.)
Datasets provide unique data for each virtual user, so your load test doesn't just hammer the same login credentials a thousand times. You'll edit datasets to add user credentials, product IDs, search terms, and anything else that varies between real users.
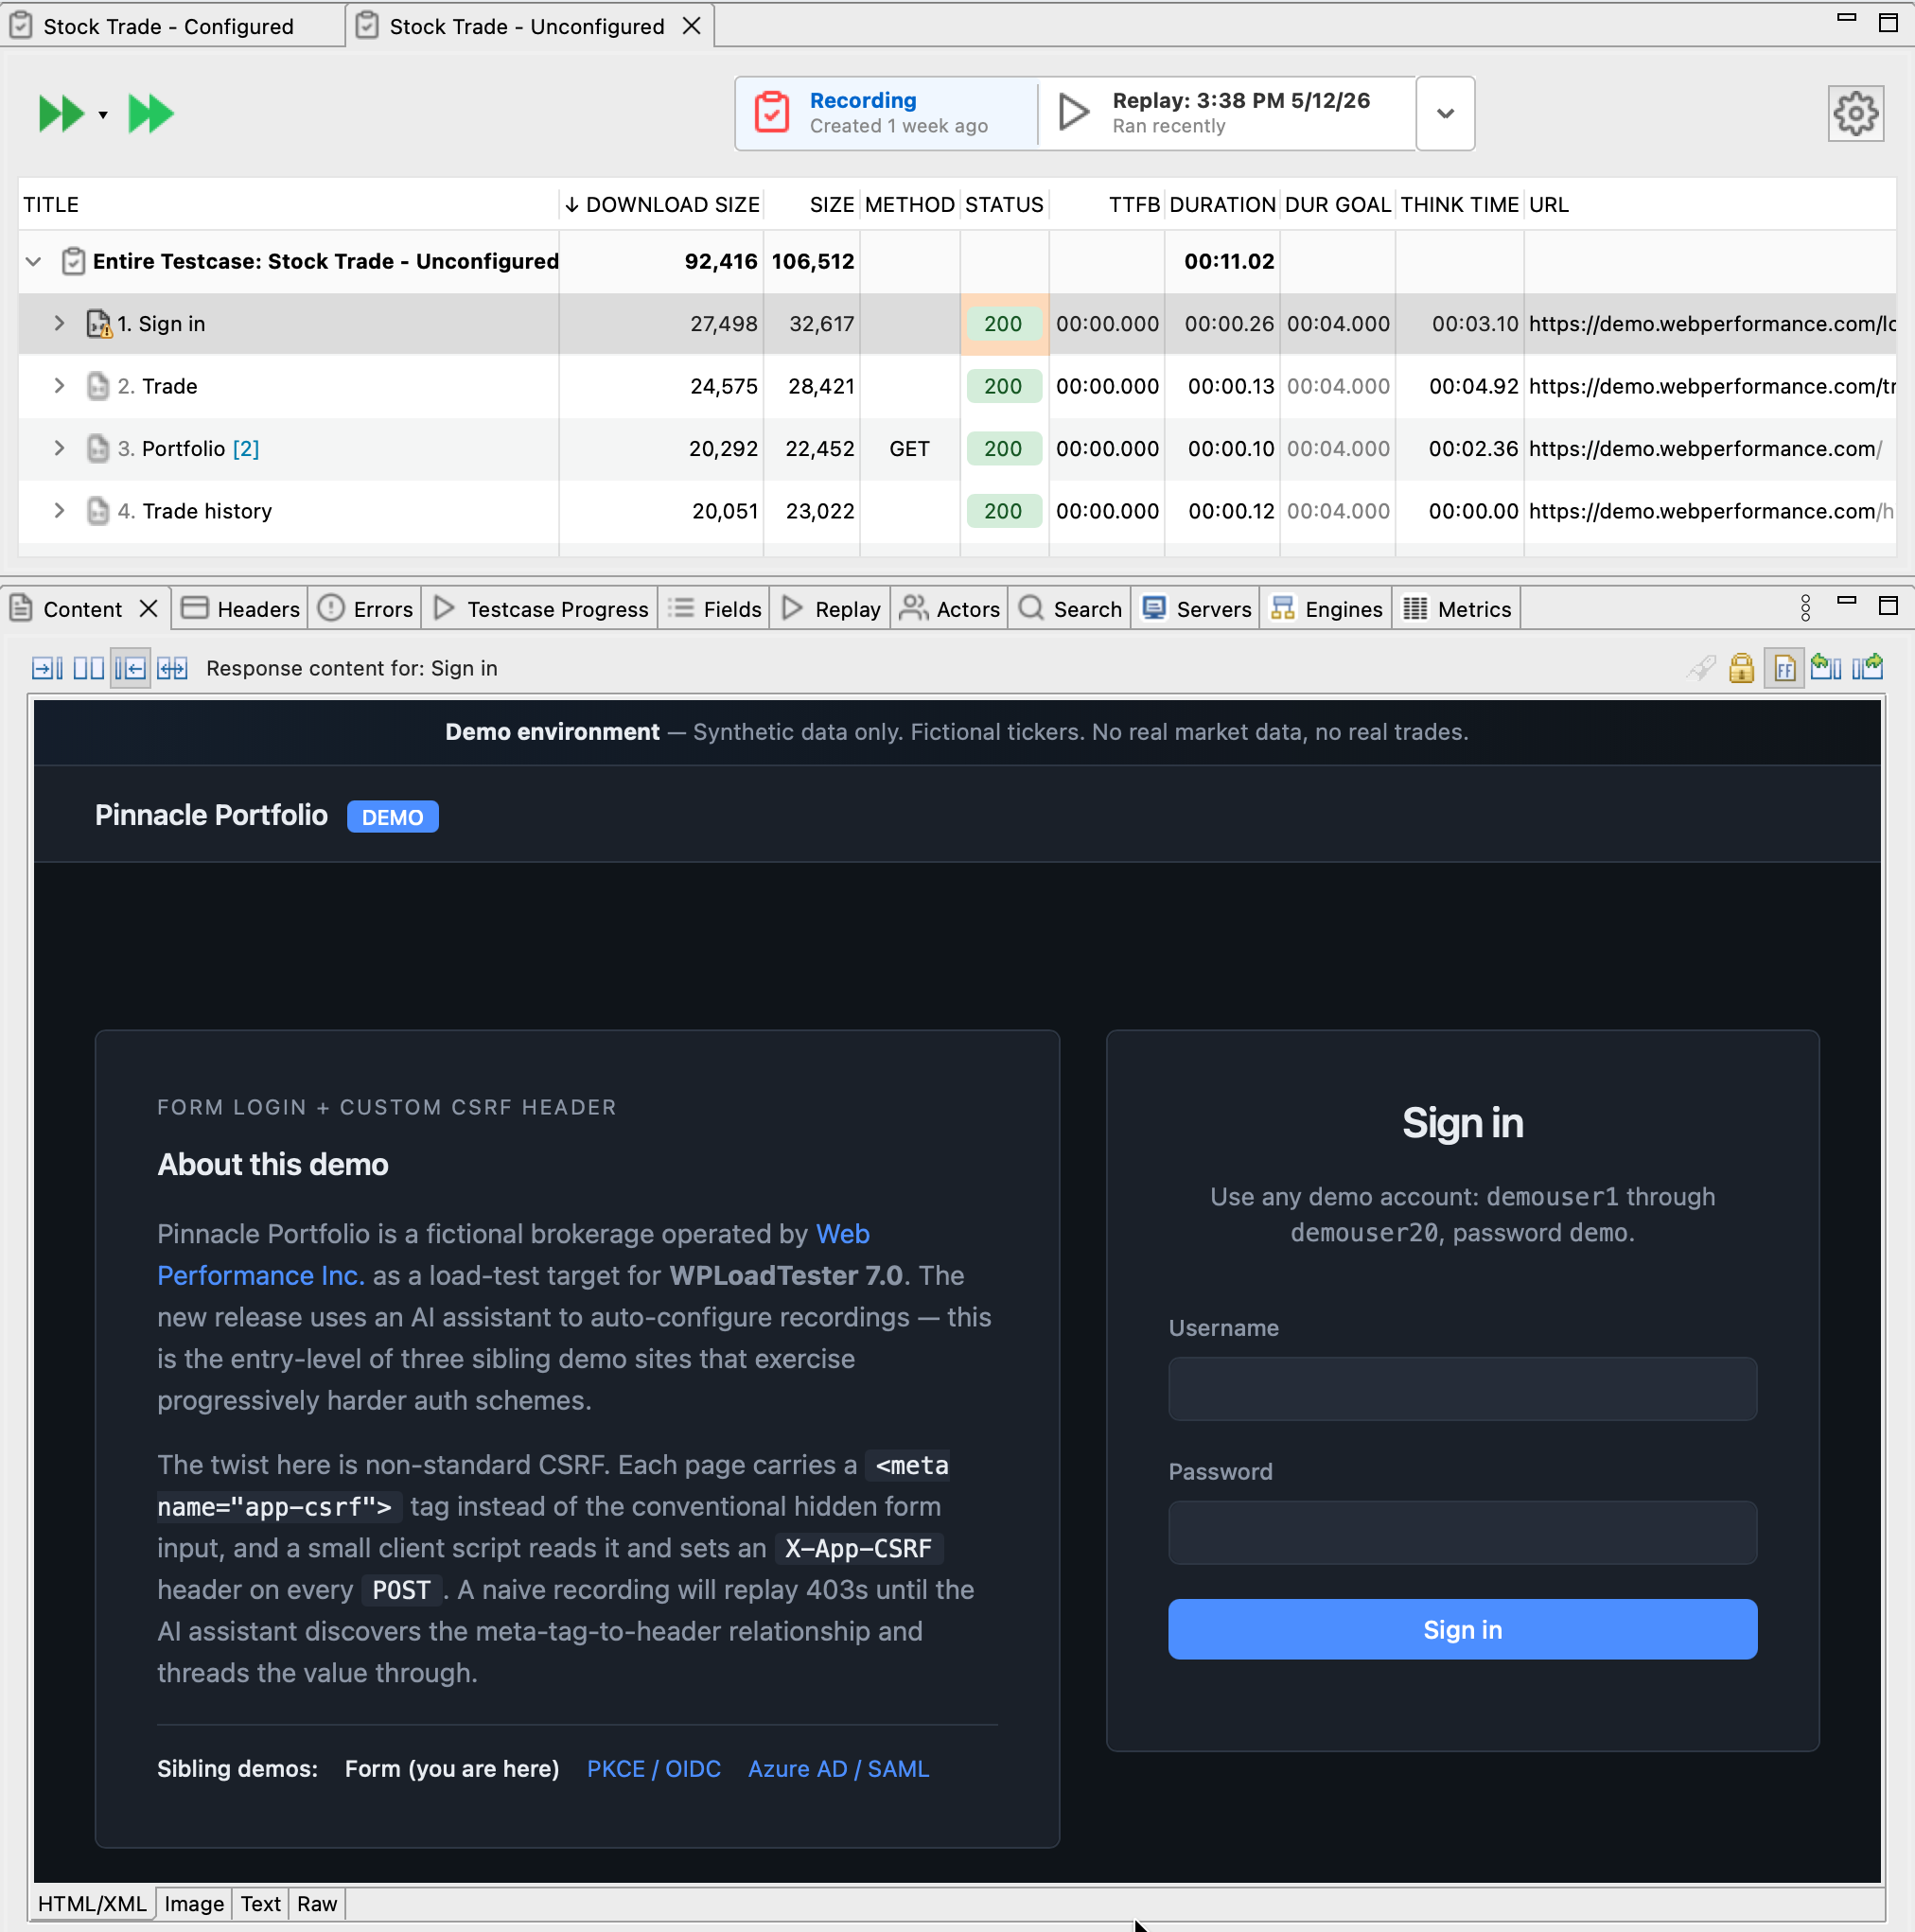
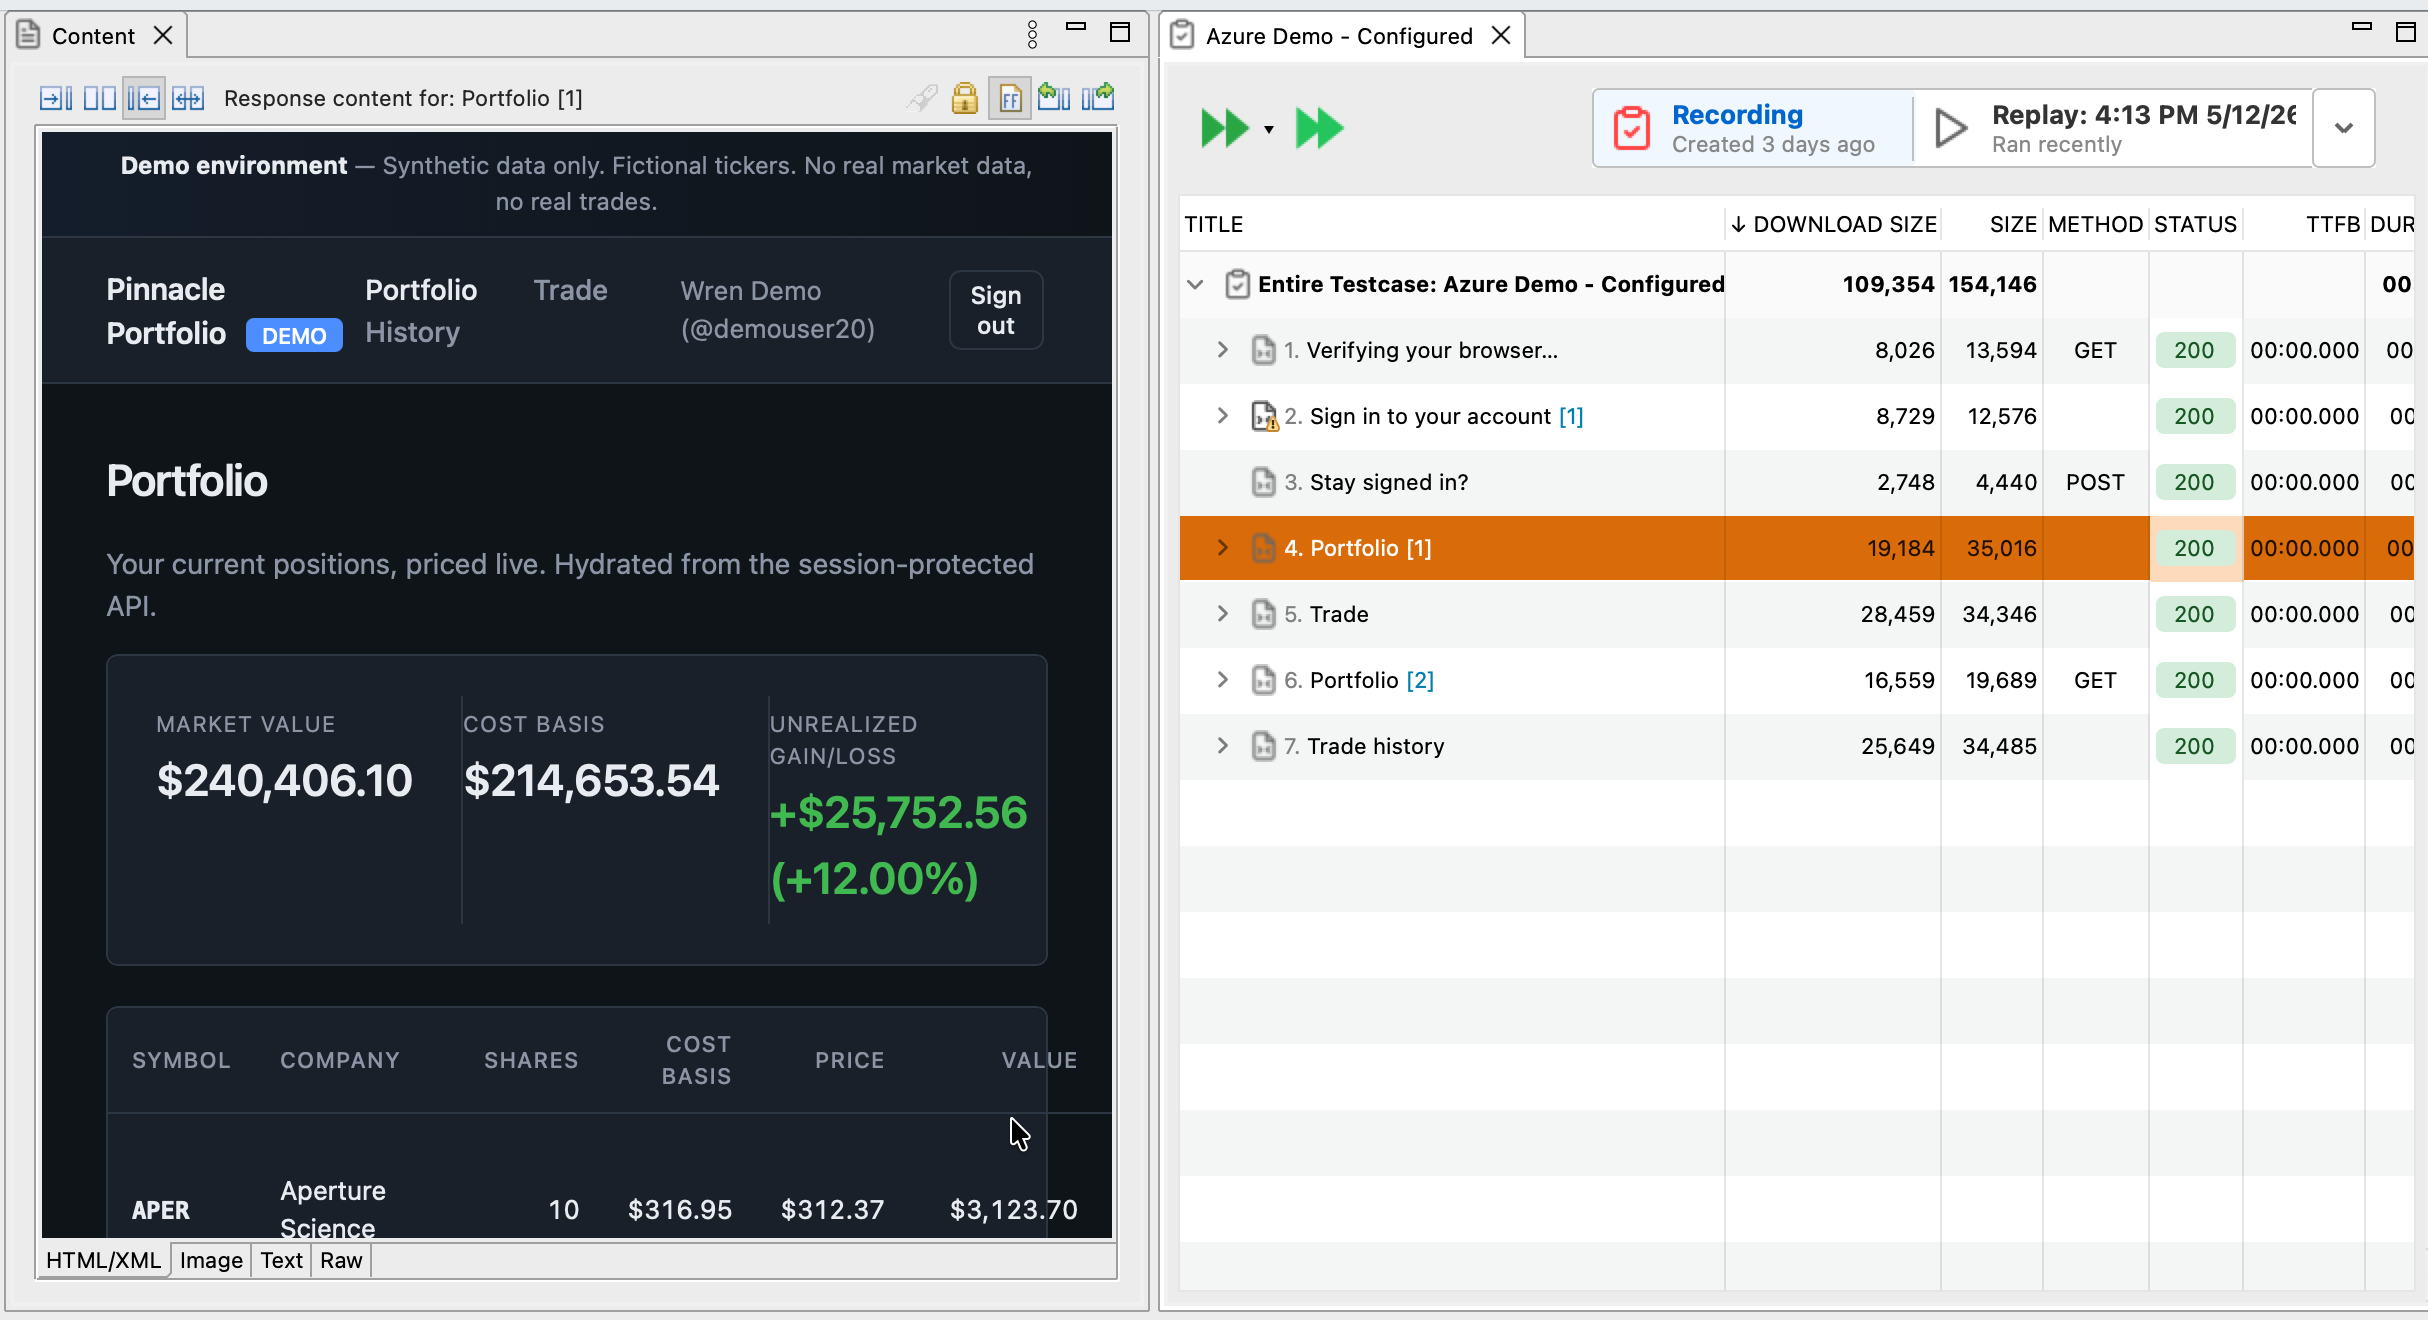
Replay Results in the Test Case Editor
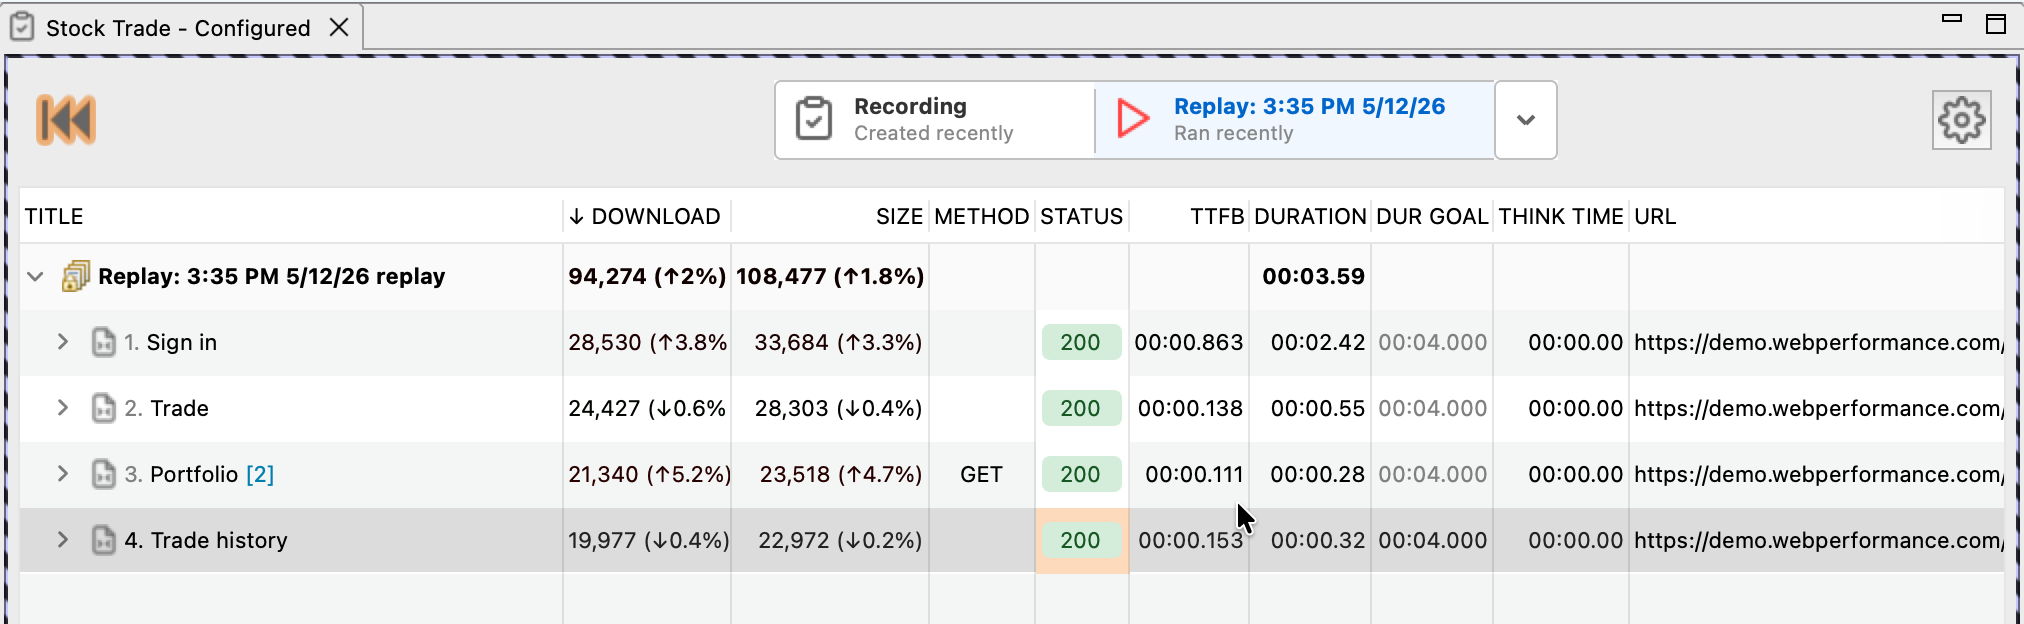
After replaying a test case, the editor displays the replay results inline, showing each page's measured metrics with percentage change versus the recording:
What you see:
- Replay banner (top) - Which replay run is being displayed and when it ran
- ↓ DOWNLOAD - Bytes downloaded, with % delta vs recording
- SIZE - Total bytes, with % delta vs recording
- METHOD / STATUS - HTTP method and status code (200 OK shown in green)
- TTFB - Time to first byte for each page
- DURATION - Total request duration
- DUR GOAL / THINK TIME - Configured page duration goal and think time
A quick scan tells you whether download sizes, response times, and status codes are tracking the recording. If a page's duration jumped or its status turned red, you'll see it without having to drill in.
For richer post-test analysis (interactive charts, drill-down by page and virtual user, server metric correlation, AI insights), open the Embedded Analytics Dashboard instead.
Views (Bottom and Sides)
Views provide detailed information about whatever you select in the Editor. They're inspector panels that reveal the details behind each page and transaction.
Content View
Shows the actual content of web pages and resources:
What it displays: - HTML pages - Rendered view (like a browser) or source code - Images - Visual preview - JSON/XML - Formatted syntax highlighting - Text files - Plain text content
Essential for debugging when responses don't match expectations. You can see exactly what the server returned, not just the status code.
Headers View
Displays HTTP request and response headers for the selected transaction:
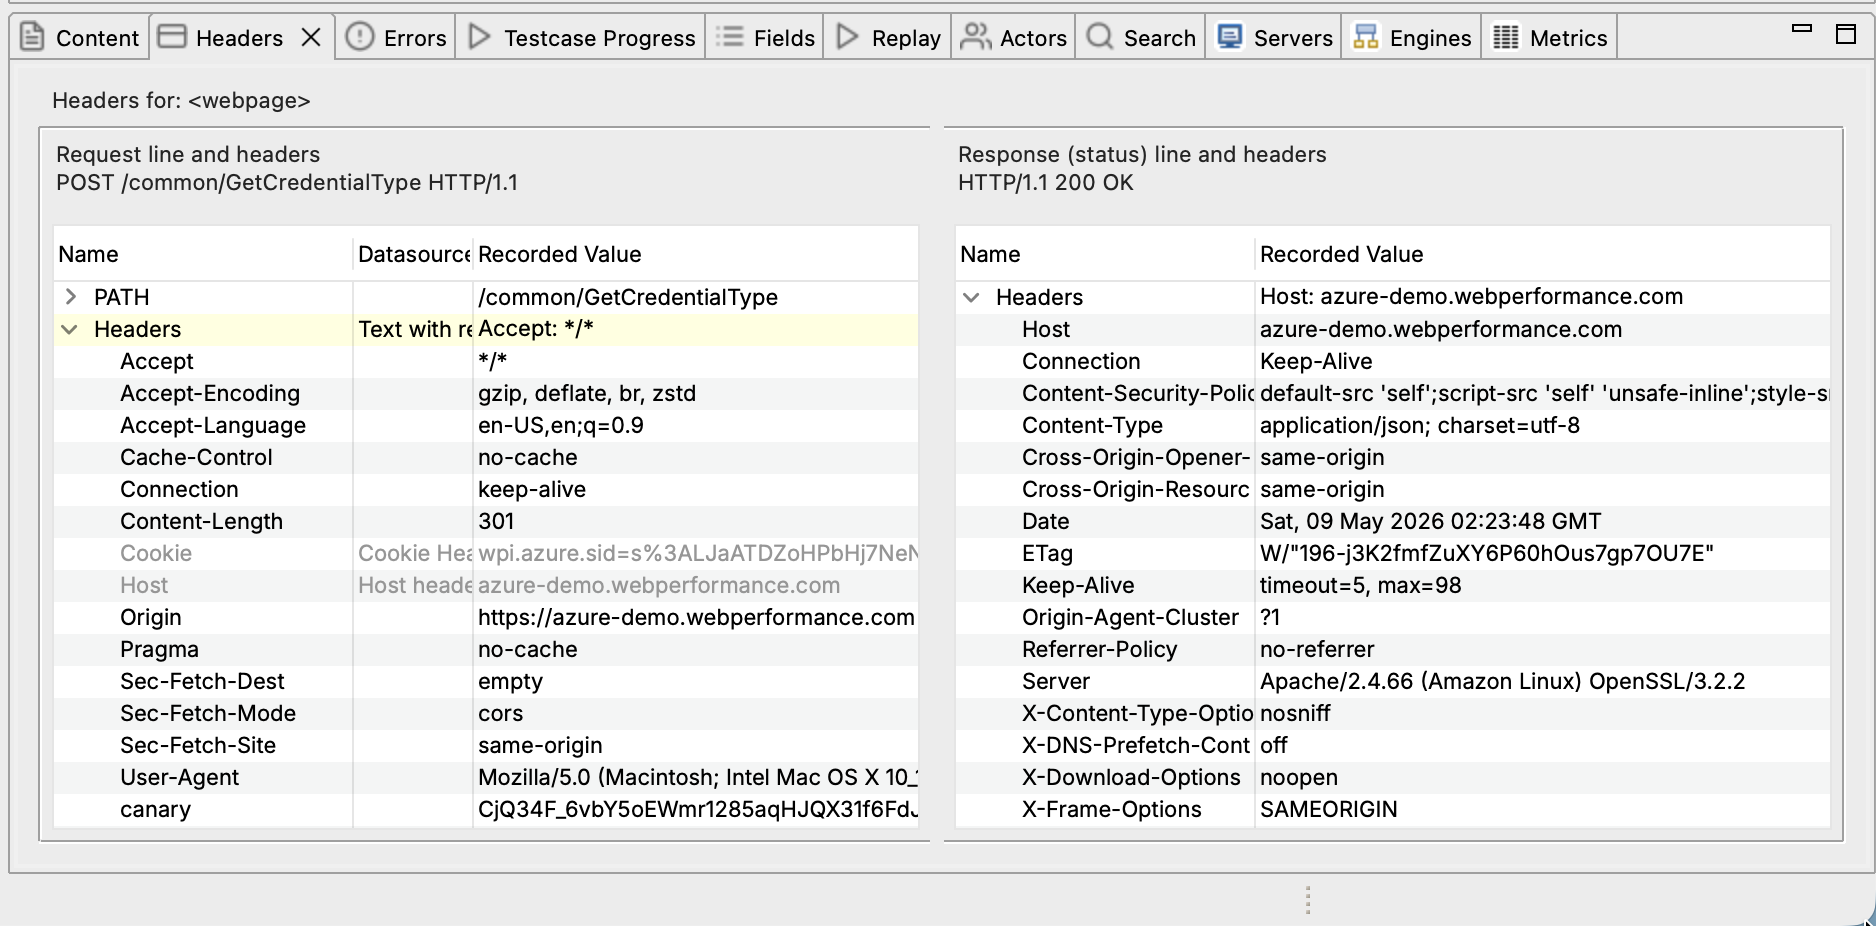
What it shows: - Request headers - What Load Tester sent (cookies, authorization, user-agent, etc.) - Response headers - What the server returned (set-cookie, content-type, cache-control, etc.)
Headers contain critical information: session cookies, CSRF tokens, authorization credentials. You'll live in this view when configuring dynamic value extraction.
Fields View
Shows form fields that can be configured with dynamic values:
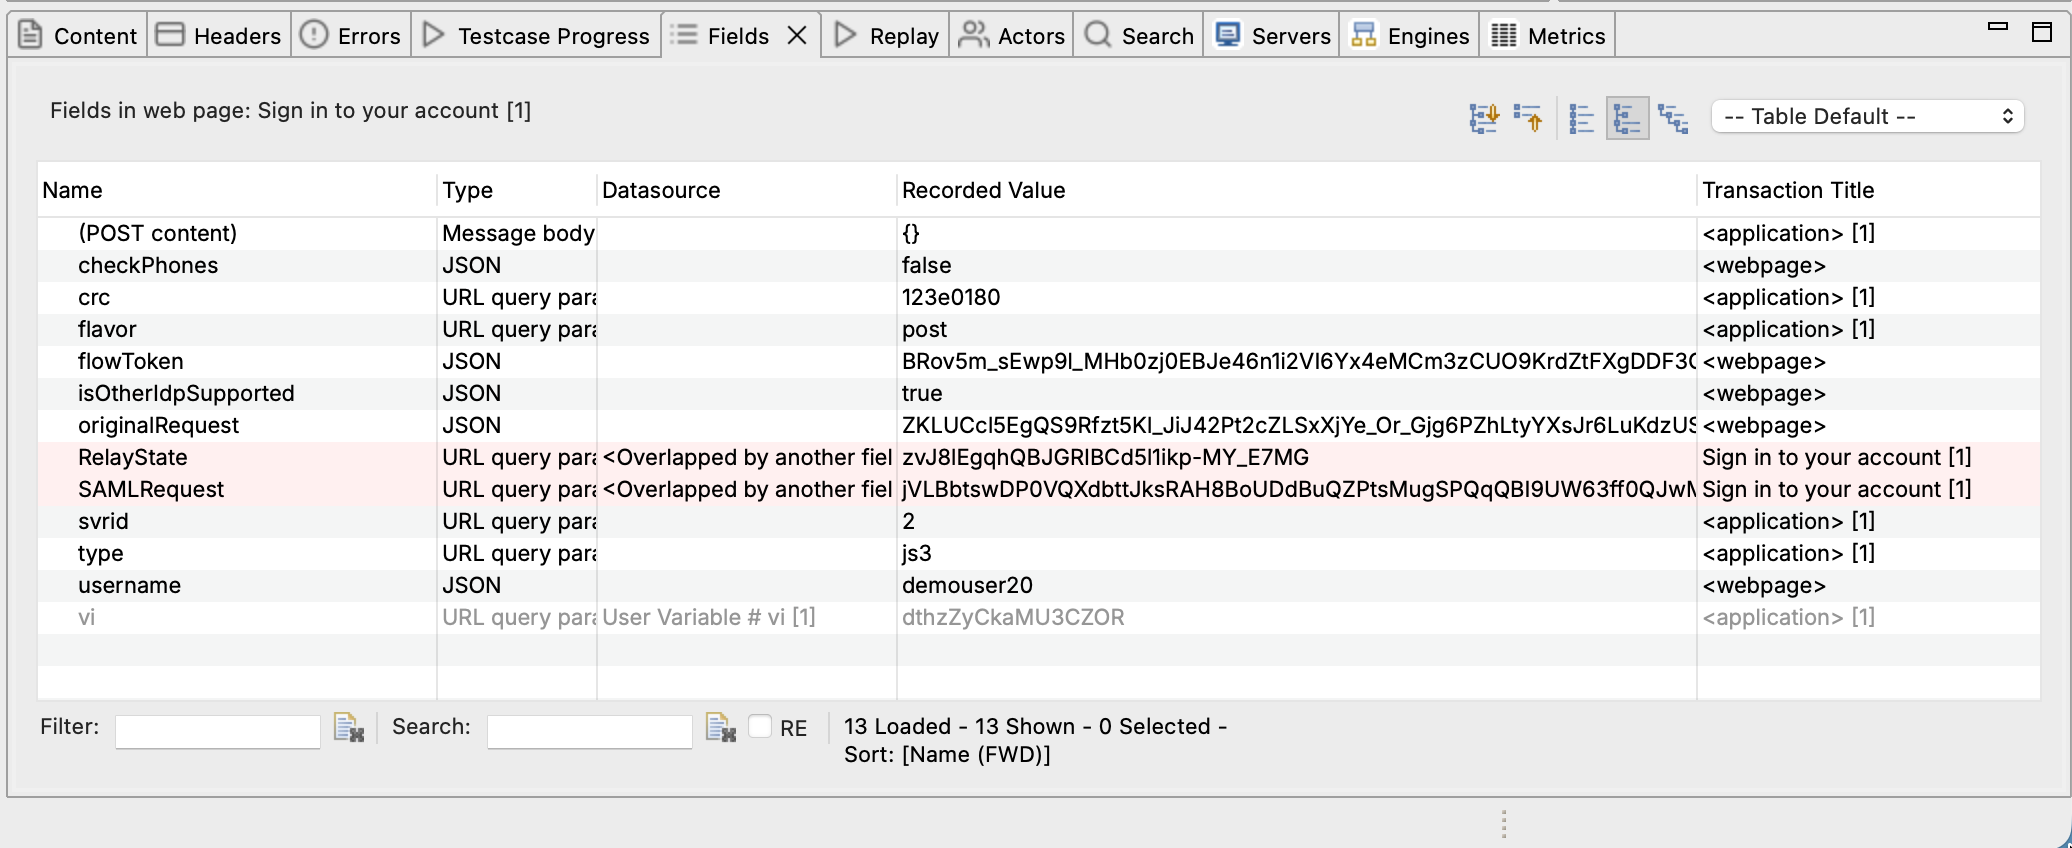
What it displays: - Field names - Form input names from HTTP requests - Values - Current value (recorded, dynamic, or from dataset) - Datasource - Where the value comes from (recorded, extracted, dataset, etc.) - Gray background - Automatically configured by ASM
This is where you configure data-driven testing and correlation. Change a field's datasource from its recorded value to a dataset column or an extracted dynamic value.
Errors View
Lists any errors encountered during recording or replay:
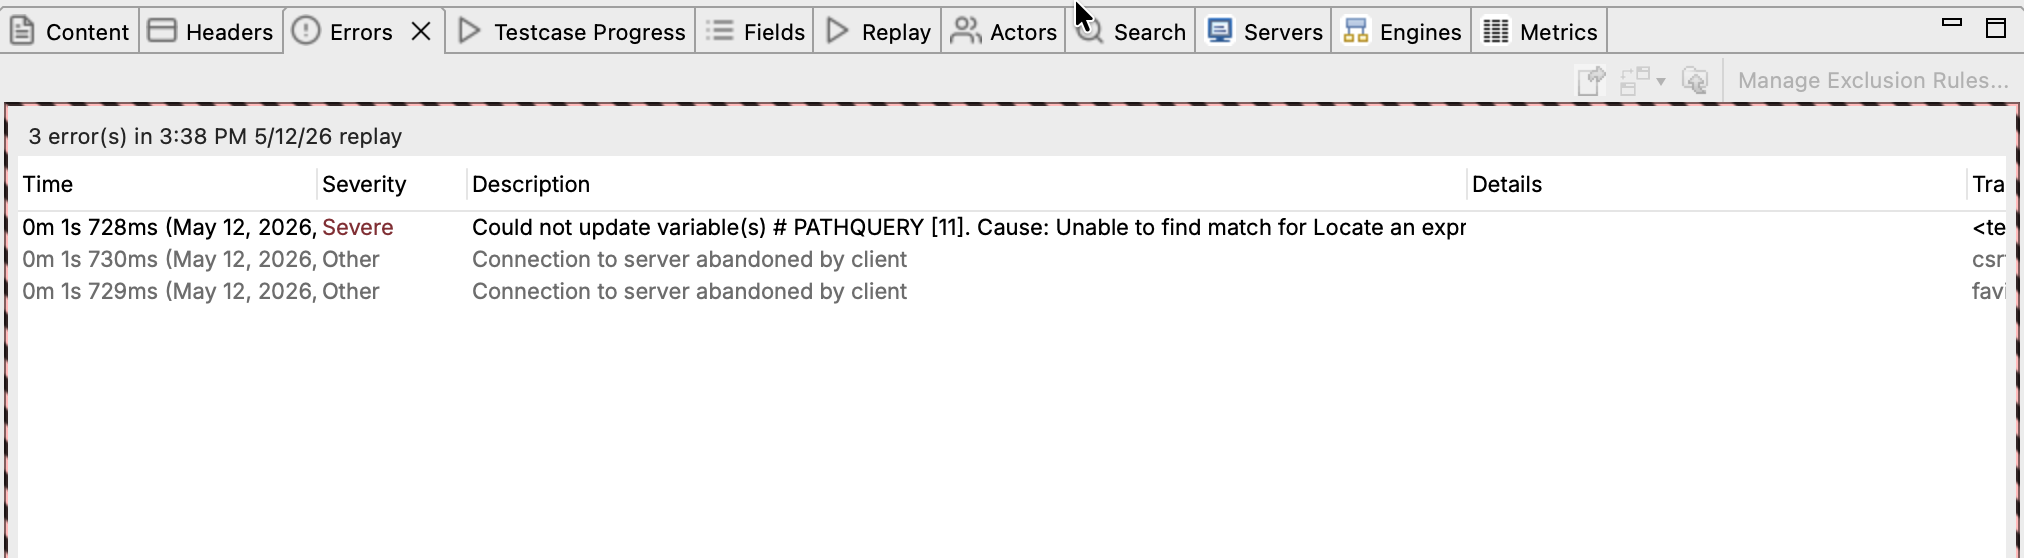
What it shows:
- Time - When the error occurred during the replay (and which replay run)
- Severity - Severe (replay-breaking) versus Other (notices, abandoned connections, etc.)
- Description - What went wrong, e.g. "Could not update variable(s) # PATHQUERY", "Connection to server abandoned by client", HTTP status errors, validation failures
- Details / Transaction - Which transaction triggered the error
When replay fails, start here. Errors are listed in time order so you can see what broke first. The first severe error is almost always the one to investigate. Click an error to jump to the transaction it came from.
Replay View
Shows real-time progress during replay: the current page being replayed, a progress bar (pages completed / total pages), status messages (extracting values, validating responses, etc.), and real-time error notifications. It gives you immediate feedback so you can catch problems as they happen, not after the run finishes.
Servers View
Displays performance metrics from monitored servers:
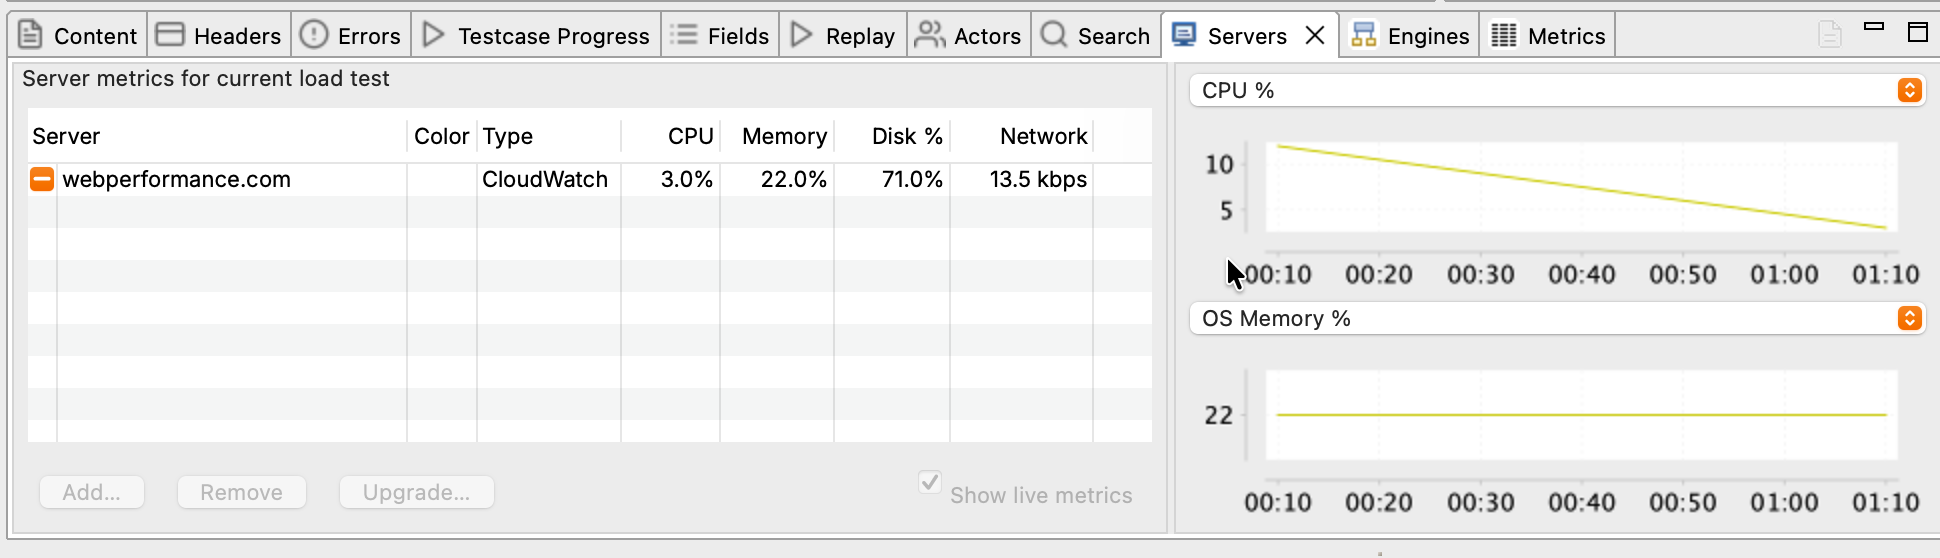
What it shows:
- Server list (left) - Each monitored server with its current CPU, Memory, Disk %, and Network throughput
- Type - How the metrics are collected (CloudWatch, agent-based, etc.)
- Metric graphs (right) - Two time-series graphs that you can switch between CPU %, OS Memory %, Disk %, and Network throughput using the dropdowns above each graph
- Show live metrics - Streams metrics in real time while a load test is running
During load testing, server metrics are how you identify bottlenecks. If response times climb but server CPU stays low, the bottleneck is elsewhere: database, external API, network. See Server Monitoring for configuration.
Status View
The Status View (bottom right) displays progress for long-running operations: recording, replay execution, load tests, and repository operations. If something seems stuck, check here first.
Customizing Your Workspace
Eclipse RCP lets you rearrange everything:
Resizing Views
Drag the borders between views to resize them. Load Tester remembers your sizes when you restart.
Make the Editor large when inspecting test cases; give the Headers View more room when debugging correlation issues.
Rearranging Views
Drag view tabs to reorder them within a tab group or move them to different positions:
- Click and hold the view's tab
- Drag toward the desired edge of the window
- Drop indicators show where the view will land
- Release to place the view
Put your most-used views in prominent positions. You'll thank yourself later.
Detaching Views
Right-click a view tab and select Detached to create a floating window. Useful for: - Multi-monitor setups (put Content View on second monitor) - Comparing multiple views side-by-side
Minimizing and Maximizing
- Double-click a view tab to maximize it (hides other views temporarily)
- Double-click again to restore
- Minimize buttons (top right of each view) collapse views to tabs
Maximize the Editor when reviewing large test cases, then restore when you need the detail views back.
Viewing Two Panes Side-by-Side
You can split the workspace into two panes and put anything in either one: two test case editors, an editor and a Content view, results from different runs, whatever you need to look at together.
- Drag the tab of any editor or view toward the left, right, top, or bottom edge of an area
- Drop indicators show where the split will land
- Release to place it alongside the existing content
Useful for comparing baseline results against current ones, inspecting a response in the Content view while the editor stays visible, or working on two test cases at once.
Restoring Default Layout
If your workspace becomes a mess:
Window → Reset Perspective - Restores the default layout
Keyboard Shortcuts
Worth memorizing:
| Action | Windows/Linux | macOS |
|---|---|---|
| Record | Ctrl+R | ⌘R |
| Replay | Ctrl+P | ⌘P |
| Save | Ctrl+S | ⌘S |
| Close Tab | Ctrl+W | ⌘W |
| Find | Ctrl+F | ⌘F |
| Maximize View | Ctrl+M | ⌘M |
See Help → Key Assist for the complete list.
Next Steps
Now that you know where everything lives:
- Record your first test case and watch the Editor and Views work together
- Follow the Quick Start Tutorial for the complete workflow
- Experiment with workspace customization to match how you actually work
Related Topics: - Quick Start Tutorial - Your First Recording - Understanding the Test Case Editor